
Page 7 - Shimadzu UV-3600 Plus
P. 7
High Resolution, Ultra-Low Stray Light, Covers a Wide Wavelength Range from Ultraviolet to Near-Infrared
and Wide Measurement Wavelength Range The wavelength range of 185 to 3,300 nm enables measurement over the ultraviolet, visible, and near-infrared regions. In
addition, the acquired spectra exhibit little noise across the entire range.
The UV-3600i Plus is equipped with a high-performance, grating-grating double monochromator, and
achieves a low stray-light level with high resolution. The wavelength range is 185 to 3,300 nm. This The figure on the right shows a spectrum obtained by measuring 100.000
instrument can perform spectrophotometry for various types of samples, ranging from those requiring toluene in the range of 185 to 3,300 nm using a cell with an optical
high resolution, such as gas samples, to highly concentrated liquid samples. path length of 2 mm. 80.000
Spectra in the ultraviolet, visible, and near-infrared regions can be
obtained. 60.000
High-Resolution Spectra of Benzene Gas T%
The spectrum shown on the left was obtained by enclosing benzene gas in a cell with an optical-path length of 10 mm and 40.000
performing measurement. The spectral bandwidth is 0.1 nm. The triplet in the neighborhood of 250 nm (enlarged on the right)
can be clearly observed. This instrument allows high-resolution spectra to be measured with little noise.
20.000
1.800
0.350
1.500 0.000
0.300 185.0 1000.0 2000.0 3000.0 3300.0
nm
0.250
1.000
Abs. Abs. The figure on the right shows the spectrum for a low-transmittance 0.150
0.200
film on a silica wafer in the range of 200 to 1,600 nm. Although the
0.500 film is a special type of film with a transmittance of almost zero, it has
0.150
been measured with high precision and little noise. (A mesh filter is
0.100
used on the reference-beam side to maintain balance with the
0.100
0.000 249.0 249.5 250.0 250.5 251.0
240.0 245.0 250.0 255.0 260.0 nm sample-beam side.)
nm T%
Ultra-Low Stray-Light Level of 0.00005 % Max. (340 nm) 0.050
The figure below on the left is a spectrum for aqueous NaNO2 solution, and the figure on the right shows an enlarged view of the
neighborhood of 340 nm. In the figure on the right, the red spectrum is for aqueous NaNO2 solution and the blue spectrum is the
0 % line obtained when a shutter block is inserted on the sample-beam side. The UV-3600i Plus achieves an ultra-low stray-light 0.000
level of less than 0.00005 % at 340 nm. -0.010
200.0 500.0 1000.0 1500.0 1600.0
(A mesh filter is used on the reference-beam side to maintain balance with the sample-beam side.) nm
100.000 0.00010
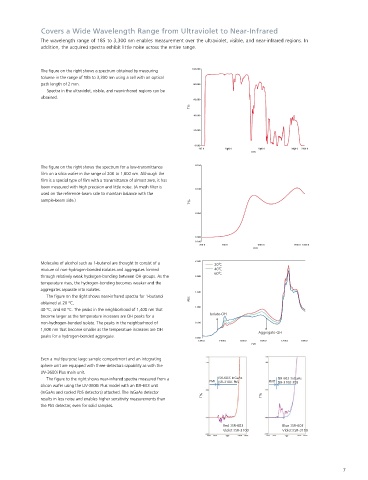
Molecules of alcohol such as 1-butanol are thought to consist of a 2.500 20℃
800.00 40℃
mixture of non-hydrogen-bonded isolates and aggregates formed
60℃
0.00005 through relatively weak hydrogen-bonding between OH groups. As the 2.000
60.00
T% T% temperature rises, the hydrogen-bonding becomes weaker and the
40.00 aggregates separate into isolates.
1.500
0.00000
The figure on the right shows near-infrared spectra for 1-butanol
obtained at 20 °C,
20.00 Abs.
1.000
40 °C, and 60 °C. The peaks in the neighborhood of 1,400 nm that
0.100 -0.00005 Isolate-OH
330.0 340.0 350.0 360.0 370.0 380.0 390.0 330.0 335.0 340.0 345.0 350.0 become larger as the temperature increases are OH peaks for a
nm nm
non-hydrogen-bonded isolate. The peaks in the neighborhood of 0.500
Linearity up to Absorbance Level 6 1,600 nm that become smaller as the temperature increases are OH
Aggregate-OH
The figure below on the left shows spectra obtained by measuring aqueous KMnO4 solution at six concentration levels. A mesh peaks for a hydrogen-bonded aggregate. 0.000
1300.0 1400.0 1500.0 1600.0 1700.0 1800.0
filter was inserted on the reference-beam side and a differential method was used to perform measurement up to absorbance nm
level 6. Using negative absorbance enables measurement with little noise, even at high absorbance levels. The figure below on
the right shows the calibration curve using peak absorbances in the vicinity of 525nm for aqueous KMnO4 solution, and shows Even a multipurpose large sample compartment and an integrating
that linearity is maintained up to absorbance level 6.
sphere unit are equipped with three-detectors capability as with the
6.000 Calibration curve UV-3600i Plus main unit.
6..000
The figure to the right shows near-infrared spectra measured from a ISR-603:InGaAs ISR-603:InGaAs
PMT ISR-3100:PbS PMT ISR-3100:PbS
silicon wafer using the UV-3600i Plus model with an ISR-603 unit
(InGaAs and cooled PbS detectors) attached. The InGaAs detector
4.000
4..000 T% T%
results in less noise and enables higher sensitivity measurements than
Abs. Abs. the PbS detector, even for solid samples.
2..000
2.000
Red:ISR-603 Blue:ISR-603
Violet:ISR-3100 Violet:ISR-3100
0..000
0.000 0..000 100.000 200.000 300.000 400.000
250.0 300.0 400.0 500.0 600.0 700.0 Concentration (mg/L)
nm
6 7