Page 6 - Shimadzu Tm Analysis System
P. 6

For more details, access here.
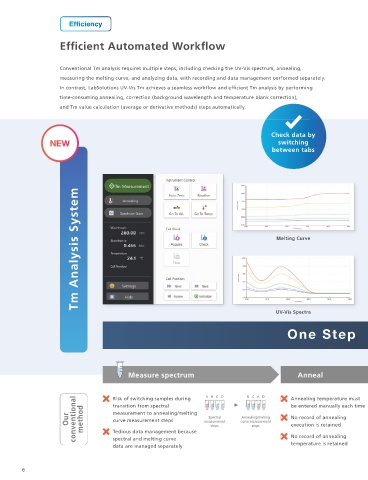
                     Efficient Automated Workflow

                                                                                                                                                                •  Automated support functions utilizing digital technologies, such as M2M, IoT, and
                                                                                                                                                                  Artificial Intelligence (AI), that enable higher productivity and maximum reliability.
                     Conventional Tm analysis requires multiple steps, including checking the UV-Vis spectrum, annealing,
                                                                                                                                                                •  Allows a system to monitor and diagnose itself, handle any issues during data acquisition
                     measuring the melting curve, and analyzing data, with recording and data management performed separately.
                                                                                                                                                                  without user input, and automatically behave as if it were operated by an expert.
                     In contrast, LabSolutions UV-Vis Tm achieves a seamless workflow and efficient Tm analysis by performing
                                                                                                                                                                •  Supports the acquisition of high-quality, reproducible data regardless of an operator’s
                     time-consuming annealing, correction (background wavelength and temperature blank correction),                                               skill level for both routine and demanding applications.
                     and Tm value calculation (average or derivative methods) steps automatically.


                                                                                           Check data by                                         Easy setting                                 Retains a record of
                  NEW                                                                        switching                                        configuration and                                 everything from
                                                                                           between tabs                                       automatic analysis                                measurement
                                                                                                                                                                                                  to analysis


                           Tm Analysis System


                                                                                             Melting Curve                                     Tm Analysis Settings

                                                                                                                                                                                                 Application log
                                                                                                                                                                                                                         LOG
                                                                                                                                                                                                (LabSolutions DB)


                                                                                            UV-Vis Spectra                                 Temperature Program Settings
                                                                                                                                                                                                                Tm Value
                                                                                                One Step                       Analysis


                                            Measure spectrum                                        Anneal                                          Measure Tm values and analyze data               Calculate Tm values


                                                                                      A
                                                                                   B C
                                                                       B C D
                                                                                        D
                                                                     A
                                                                                                                                                  records prevents Tm value reproducibility
                                                                                                 be entered manually each time
                                      transition from spectral
                                      measurement to annealing/melting
                        Our  conventional  method  Risk of switching samples during   measurement  curve measurement  Annealing temperature must   Lack of analysis process/parameter                   Tm Value        Tm Value
                                                                                                 No record of annealing
                                                                                 Annealing/melting
                                                                      Spectral
                                      curve measurement steps
                                                                                                 execution is retained
                                                                       steps
                                                                                    steps
                                      Tedious data management because
                                      spectral and melting curve
                                                                                                 temperature is retained
                                      data are managed separately                                No record of annealing                                                                           Analysis results can vary depending
                                                                                                                                                                                                  on the analyst
        6                                                                                                                                                                                                                                    7
   1   2   3   4   5   6   7   8