Page 10 - Shimadzu LCMS-2020
P. 10

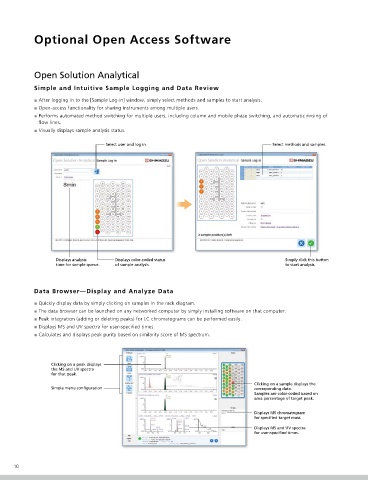
Optional Open Access Software


            Open Solution Analytical                                                                                                  Open Solution Purification


            Simple and Intuitive Sample Logging and Data Review                                                                       Open Access Sample Purification and Automated Scale-Up
            ■ After logging in to the [Sample Log-in] window, simply select methods and samples to start analysis.                    ■ Simple and intuitive sample submission and fraction collection.
            ■ Open-access functionality for sharing instruments among multiple users.                                                 ■ Scale-up feature automatically formulates prep LC conditions from analytical results using matched columns and mobile phases.
            ■ Performs automated method switching for multiple users, including column and mobile phase switching, and automatic rinsing of   ■ Easy display of fractionation results
              flow lines.
            ■ Visually displays sample analysis status.                                                                                               Acidic          Basic

                                    Select user and log in.                                Select methods and samples.
                                                                                                                                                                                   Analysis

                                                                                                                                                                                   • Easy sample log-in through Open Solution interface.
                                                                                                                                                                                   • Automatically performs analytical separations under multiple
                                                                                                                                                                                    conditions.
                                                                                                                                                                                   • Data from using each method is analyzed to automatically
                                                                                                                                                                                    determine the optimal parameters.
                                                                                                                                                                                   • Displays a comparison of results from multiple methods.


                    Displays analysis   Displays color-coded status                             Simply click this button
                    time for sample queue.  of sample analysis.                                 to start analysis.                                                                                                       OK
                                                                                                                                      Fractionation
                                                                                                                                      • Automatically creates a batch queue for
            Data Browser—Display and Analyze Data                                                                                       purification works with three color coding when                                   Impurities
                                                                                                                                        analysis results files are loaded.                                                might be
                                                                                                                                                                                                                         present.
            ■ Quickly display data by simply clicking on samples in the rack diagram.                                                 • Green signal means "Go ahead for purification"
                                                                                                                                        but orange signal tells you there is a risk of
            ■ The data browser can be launched on any networked computer by simply installing software on that computer.
                                                                                                                                        impurity when you conduct the purification with
            ■ Peak integration (adding or deleting peaks) for LC chromatograms can be performed easily.                                 the given method.                                                                No target
            ■ Displays MS and UV spectra for user-specified times.                                                                                                                                                        peaks exist.
            ■ Calculates and displays peak purity based on similarity score of MS spectrum.


                  Clicking on a peak displays
                  the MS and UV spectra
                  for that peak.
                                                                                     Clicking on a sample displays the                                                             Purification Results
                  Simple menu configuration                                           corresponding data.
                                                                                     Samples are color-coded based on                                                              • Display fractionation results using Open Solution data browser
                                                                                     area percentage of target peak.
                                                                                                                                                                                    from any networked PC.
                                                                                                                                                                                   • Click on any collection vessel in the display window to examine MS
                                                                                     Displays MS chromatogram
                                                                                     for specified target mass.                                                                      or UV spectra for that fraction. Purity results are color-coded in the
                                                                                                                                                                                    display window.
                                                                                     Displays MS and UV spectra
                                                                                     for user-specified times.


                                                                                                                                                                                                                           LCMS-2020
      10                                                                                                                                                                                                               Liquid Chromatograph Mass Spectrometer  11
   5   6   7   8   9   10   11   12