
Page 80 - LC-SFC_Pharma_Brochure
P. 80
2. Usage-Case Examples 2-2. Pharmaceutical Preparation Development Studies:
2-1. API Process Studies: Outputting Scouting Results for Chiral Compounds Outputting Trend Plots for Dissolution Testing
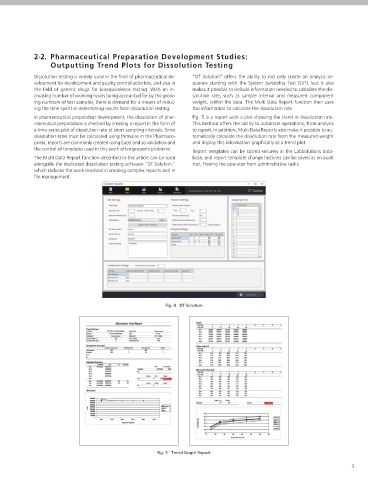
Dissolution testing is widely used in the field of pharmaceutical de- "DT Solution" offers the ability to not only create an analysis se-
In the API research area, chiral columns are being studied for quick quantitative analysis of the large volumes of data acquired during velopment for development and quality control activities, and also in quence starting with the System Suitability Test (SST), but it also
and efficient resolution of optical isomers. Finding the appropriate method scouting. the field of generic drugs for bioequivalence testing. With an in- makes it possible to include information needed to calculate the dis-
column and mobile phase conditions for a given analysis from the Fig. 2 shows data obtained from methylclothiazide screening and creasing number of working hours being accounted for by the grow- solution rate, such as sample interval and measured component
wide variety of chiral columns available is a time-consuming and la- Fig. 3 compares different resolution conditions. Data are displayed as ing numbers of test samples, there is demand for a means of reduc- weight, within the data. The Multi Data Report function then uses
bor-intensive process, so there is a demand for more efficient means graphs ranked in the order of degree of resolution, so the user can ing the time spent in determining results from dissolution testing. this information to calculate the dissolution rate.
of developing separation conditions for chiral compounds. quickly determine the most appropriate column and resolution con-
Shimadzu offers a "Method Scouting System," which by combining ditions for a given chiral compound. In pharmaceutical preparation development, the dissolution of phar- Fig. 5 is a report with a plot showing the trend in dissolution rate.
maceutical preparations is checked by creating a report in the form of
This method offers the ability to automate operations, from analysis
solvent switching valves and column switching valves, is capable of In addition to the degree of resolution, other parameters obtained a time-series plot of dissolution rate at short sampling intervals. Since to report. In addition, Multi Data Reports also make it possible to au-
automatically and continuously acquiring comprehensive data from during analysis such as the symmetry factor, number of peaks de- dissolution rates must be calculated using formulas in the Pharmaco- tomatically calculate the dissolution rate from the measured weight
up to 192 column and mobile phase combinations. However, deter- tected, and number of theoretical plates can be used freely to create poeia, reports are commonly created using Excel and so validation and and display this information graphically as a trend plot.
mining optimum resolution conditions from the large volumes of evaluations according to the application. the control of templates used in this work often presents problems.
data obtained during method scouting is time-consuming work that Report templates can be stored securely in the LabSolutions data-
has its own set of issues, such as different operators generating dif- This method removes operator influence from column scouting, and The Multi Data Report function described in this article can be used base, and report template change histories can be saved as an audit
ferent results from the same dataset. through the use of qualitative data also improves the reliability of alongside the dedicated dissolution testing software "DT Solution," trail, freeing the operator from administrative tasks.
scouting results. which reduces the work involved in creating complex reports and in
The Multi Data Report function described in this article facilitates
file management.
Scouting Report Summary
Rank Data File Evaluation Value Peak Count Separated Peak Count Resolution Resolution Factor Tailing Factor1 Tailing Factor2 k'1 k'2 Area%1 Area%2
Methylclothiazide_ID_n-Hex_EtOH_3_analysis_B20%_14min_035.lcd 7.569 2 2 3.785 1.523 1.310 1.463 5.665 8.626 49.777 50.223
Methylclothiazide_IF_MC_EtOH_6_analysis_B2%_4min_078.lcd 6.173 2 2 3.086 1.858 1.127 1.094 1.390 2.583 52.748 47.252
Methylclothiazide_IB_MC_EtOH_6_analysis_B2%_4min_070.lcd 4.912 2 2 2.456 2.248 0.715 1.094 0.443 0.995 45.633 54.367
4 Methylclothiazide_IC_n-Hex_EtOH_3_analysis_B20%_14min_033.lcd 3.155 2 2 1.577 1.238 1.264 1.300 2.821 3.493 47.960 52.040
5 Methylclothiazide_IF_n-Hex_EtOH_4_analysis_B100%_18min_052.lcd 3.030 2 1 1.515 2.759 1.465 - 0.102 0.282 48.153 51.847
6 Methylclothiazide_IF_MTBE_EtOH_8_analysis_B2%_4min_104.lcd 2.602 2 0 1.301 1.327 - - 1.361 1.806 48.306 51.694
7 Methylclothiazide_IF_n-Hex_IPA_2_analysis_B40%_14min_026.lcd 2.433 2 1 1.217 1.807 1.854 - 1.436 2.595 48.504 51.496
8 Methylclothiazide_IA_n-Hex_EtOH_3_analysis_B20%_14min_029.lcd 2.326 2 0 1.163 1.156 - - 4.943 5.714 48.006 51.994
9 Methylclothiazide_IC_n-Hex_IPA_2_analysis_B40%_14min_020.lcd 2.295 2 0 1.147 1.296 - - 1.962 2.543 48.356 51.644
10 Methylclothiazide_IA_MTBE_EtOH_8_analysis_B2%_4min_094.lcd 2.202 2 0 1.101 1.209 - - 2.128 2.573 46.618 53.382
Fig. 2 Screening Results Summary
®
mAU [Rank 1st] Column: CHIRALPAK ID
150
Fig. 4 DT Solution
100
50
Analytical conditions
0
• Mobile phase : Hexane/Ethanol=8/2 (v/v)
0.0 2.5 5.0 7.5 10.0 12.5 min • Flowrate : 3 mL/min
[Rank 4th] Column: CHIRALPAK IC • Analysis time : 14 min
®
mAU
250 • Column temperature : 40 °C
• Injection volume : 10 µL
200
150
100
50
0
0.0 2.5 5.0 7.5 10.0 12.5 min
Fig. 3 Comparison of Resolution Conditions Fig. 5 Trend Graph Report
2 3