
Page 81 - LC-SFC_Pharma_Brochure
P. 81
C191-E046
2-3. Quality Assessment Studies: Outputting Results from Analytical Method Validation
2-3. Quality Assessment Studies: Outputting Results fr om Analytical Method V alidation
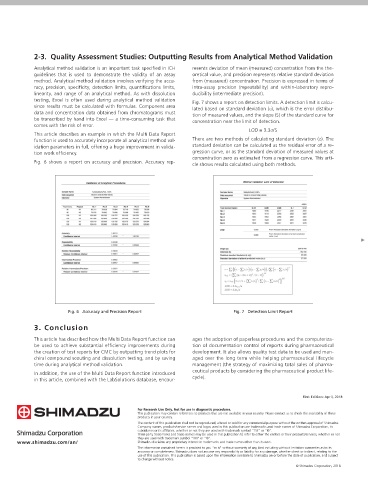
Analytical method validation is an important task specified in ICH resents deviation of mean (measured) concentration from the the-
guidelines that is used to demonstrate the validity of an assay oretical value, and precision represents relative standard deviation Improving Ef ciency in the Preparation of
method. Analytical method validation involves verifying the accu- from (measured) concentration. Precision is expressed in terms of Technical
racy, precision, specificity, detection limits, quantifications limits, intra-assay precision (repeatability) and within-laboratory repro- Test Reports for Chemistry, Manufacturing,
linearity, and range of an analytical method. As with dissolution ducibility (intermediate precision). Report
testing, Excel is often used during analytical method validation Fig. 7 shows a report on detection limits. A detection limit is calcu- and Control (CMC) Using Multi Data Report
since results must be calculated with formulas. Component area lated based on standard deviation (σ), which is the error distribu-
data and concentration data obtained from chromatograms must tion of measured values, and the slope (S) of the standard curve for
be transcribed by hand into Excel — a time-consuming task that concentration near the limit of detection. Satoru Watanabe and Tadayuki Yamaguchi 1
1
comes with the risk of error.
LOD = 3.3σ/S
This article describes an example in which the Multi Data Report
function is used to accurately incorporate all analytical method val- There are two methods of calculating standard deviation (σ). The
idation parameters in full, offering a huge improvement in valida- standard deviation can be calculated as the residual error of a re- Abstract:
tion work efficiency. gression curve, or as the standard deviation of measured values at In order to demonstrate the quality of pharmaceutical products, pharmaceutical manufacturers must perform process studies into the
concentration zero as estimated from a regression curve. This arti-
Fig. 6 shows a report on accuracy and precision. Accuracy rep- active pharmaceutical ingredients (API) and studies into the pharmaceutical preparation process, and quality assessment for both of these
cle shows results calculated using both methods.
as part of their chemistry, manufacturing, and control (CMC) activities. HPLC is used widely in such investigations for reaction tracing and
impurity identiÿcation in API process studies, uniformity testing, and dissolution testing in pharmaceutical preparation development
studies, and for analytical method validation in assay development for quality assessment studies.
The results of these studies must be tabulated according to the objectives and summarized in reports. It is often the case that these results
are copied into Excel or similar software before a report is created. This article describes three examples of how the LabSolutions Multi
Data Report feature is used in pharmaceutical development studies.
(1) API process studies: Outputting scouting results for chiral compounds
(2) Pharmaceutical preparation development studies: Outputting trend plots for dissolution testing
(3) Quality assessment studies: Outputting results from analytical method validation
Keywords: LabSolutions DB/CS, Multi Data Report, analytical method validation, method scouting, dissolution testing
oduction
1. Intr
1. Introduction
LabSolutions offers a Multi Data Report function that can combine The Multi Data Report function uses report templates that allow for-
multiple types of analytical data and create an Excel-like report. Using mulas similar to Excel to be included, so report formats previously used
this function provides substantial efficiency improvements during the in Excel can be used in the Multi Data Report function. Report tem-
preparation of test reports for CMC. plates are managed securely in the LabSolutions database, and the
Although Excel has long been used to create these reports, this change history for report templates can be saved as an audit trail.
method requires the manual copying of analytical data, which is both When reports are created using the Multi Data Report function, they
Fig. 6 Accuracy and Precision Report Fig. 7 Detection Limit Report labor-intensive and can introduce errors. Excel document change con- are populated with analytical results in a seamless process that saves
trol is also often left to the individual operator, which introduces the on labor and prevents the introduction of transcription errors when
3. Conclusion risk of multiple templates existing simultaneously, and the possibility of Excel is used, thus enabling substantial improvements in data reliability
3. Conclusion
tampering with formulas or results.
and work efficiency to be achieved.
This article has described how the Multi Data Report function can ages the adoption of paperless procedures and the computeriza-
be used to achieve substantial efficiency improvements during tion of documentation control of reports during pharmaceutical LabSolutions Database
the creation of test reports for CMC by outputting trend plots for development. It also allows quality test data to be used and man-
chiral compound scouting and dissolution testing, and by saving aged over the long term while helping pharmaceutical lifecycle Data 1 Data 2 Data 3 Data 1 Data 2 Data 3
time during analytical method validation. management (the strategy of maximizing total sales of pharma- Conc. Conc. 3.019 2.998 3.011
(mg/L) (mg/L)
ceutical products by considering the pharmaceutical product life- Ave. Ave. 3.009
In addition, the use of the Multi Data Report function introduced (mg/L) (mg/L)
in this article, combined with the LabSolutions database, encour- cycle).
Data Report Template Create Report
LabSolutions DB
First Edition: April, 2018
Templdate Editor
• Standard Function Support
• Create Report in Excel-like
• Audit Trail Support
Fig. 1 Outline of the Multi Data Report Function
© Shimadzu Corporation, 2018 1 Analytical & Measuring Instruments Division 1