
Page 9 - Food&Beverage Dioxin in Food
P. 9
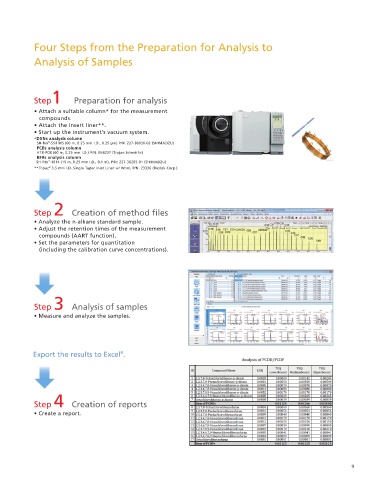
Analysis of Samples  Four Steps from the Preparation for Analysis to


 GCMS-TQ8050 (Method Package for Dioxins in Foods)  Analysis of Samples


 The method package consists of method  les registered with the   Step1
 optimal conditions for the analysis of dioxins, as well as a report    Preparation for analysis
 creation tool that can output the items required by EU regulations.   • Attach a suitable column* for the measurement
 This makes it possible to start an analysis without the having to      compounds.
            • Attach the insert liner**.
 investigate analytical conditions.  • Start up the instrument’s vacuum system.
            *DXNs analysis column
                 ™
 ■Method  les registered with the optimal conditions for the analysis of dioxins     SH-Rxi -5Sil MS (60 m, 0.25 mm I.D., 0.25 µm) P/N: 227-36036-02 (SHIMADZU)
 Optimized analysis conditions (including transition and CE) are pre-registered in the method  les. Additionally, the  les are registered with retention     PCBs analysis column
              HT8-PCB (60 m, 0.25 mm I.D.) P/N: 054237 (Trajan Scienti c)
 times and retention indices, and the retention times can be adjusted automatically using the retention time adjustment function  Point    BFRs analysis column
 1
 (AART: Automatic Adjustment of Retention Time), allowing analysis to start immediately.    SH-Rtx -1614 (15 m, 0.25 mm I.D., 0.1 m), P/N: 227-36265-01 (SHIMADZU)
                 ™
 Note that a comparison test (an analysis of 44 types and 201 samples of foods and feeds) with magnetic sector GC-MS was implemented using these   **Topaz  3.5 mm I.D. Single Taper Inlet Liner w/ Wool, P/N: 23336 (Restek Corp.)
                 ®
 method  les and a Shimadzu TQ, and the performance was con rmed.
 ■Report creation tool, capable of outputting items required by EU regulations
 Reports of the analysis of dioxins in foods must contain the results of complicated calculations. A report creation tool is included in this product. It can
 automatically create reports showing items required by EU regulations. Additionally, it is capable of combining reports on DXNs and PCBs, changing the   Point
 items displayed, and showing the Limit of Quanti cation (LOQ) calculation method, providing support to varied customer analyses.  2
            Step 2       Creation of method  les
            • Analyze the n-alkane standard sample.
            • Adjust the retention times of the measurement
 Point  Automatic adjustment of retention times using the AART function     compounds (AART function).
 1          • Set the parameters for quantitation
               (including the calibration curve concentrations).
 The retention times and retention indices for the target   Before Cutting the Column
 compounds are registered in the method  les. The AART
 function adjusts the retention times for the target
 compounds using the retention indices for the target
 compounds and the results of the analysis of an n-alkane   Alkanes with different
 standard sample. The retention times and time programs are   carbon numbers are
 investigated at a wide range
 automatically adjusted even if the retention times for the   Retention Time: 26 Minutes  of retention times, so the   Step 3

 target compounds change, such as for maintenance of the   After Cutting the Column  retention times of target   Analysis of samples
 compounds with a variety of
 column tip.  boiling points can be   • Measure and analyze the samples.
 adjusted with high accuracy.


 Estimated Retention Time: 25 Minutes
            Export the results to Excel .
                                         ®
 Point  Report creation tool, capable of outputting items required by
 2  EU regulations

 DXNs
 In the analysis of dioxins in foods, DXN analysis samples and   +
 PCB analysis samples are prepared from a single sample.   PCBs   Step 4
 However, depending on the pretreatment method, some of   Creation of reports
 the PCBs can become mixed into the DXN sample, so the   • Create a report.
 analysis results for PCBs are sometimes divided into two parts.
 With this product’s report creation tool, even if the analysis
 results for PCBs are divided into two parts, they can be
 PCBs
 combined, enabling support for a variety of samples and
 pretreatment methods.  Reports Can Be Created Combining the Two Analysis Results


 8                                                                                                                   9