
Page 21 - LifeScience Solution for FNIRS
P. 21
For Research Use Only. Not for use in diagnostic procedures.
Mental Disorder Research Light to Measure Brain Function Principle of Using Near Infrared
Data Imaging Optical Brain-Function
Brain Activity Changes in the Prefrontal Cortex of Subjects with Depression or Bipolar Disorder Results
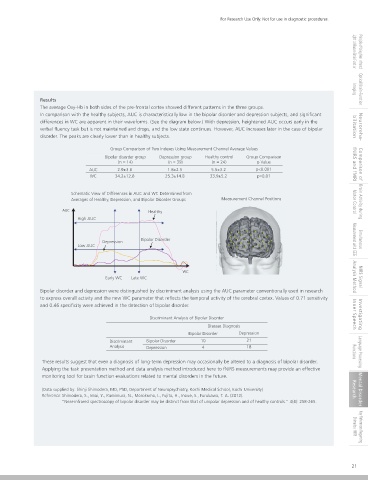
During Verbal Fluency Tasks The average Oxy-Hb in both sides of the pre-frontal cortex showed different patterns in the three groups.
Cognitive impairment and associated functional disorders of the frontal lobe are known characteristics in depression subjects. Verbal In comparison with the healthy subjects, AUC is characteristically low in the bipolar disorder and depression subjects, and significant
fluency tasks are widely used in brain-function research as one of the most sensitive methods of determining cognitive impairment. differences in WC are apparent in their waveforms. (See the diagram below.) With depression, heightened AUC occurs early in the
verbal fluency task but is not maintained and drops, and the low state continues. However, AUC increases later in the case of bipolar bilitation Neuroreha-
fNIRS measurements of Oxy-Hb concentration using 42 prefrontal cortex channels were conducted on 14 bipolar disorder subjects, 39
disorder. The peaks are clearly lower than in healthy subjects.
depression subjects, and 24 healthy subjects performing verbal fluency tasks. The new task presentation method and data analysis
method found significantly lower Oxy-Hb concentration in the depression and bipolar disorder groups compared to the healthy group, Group Comparison of Two Indexes Using Measurement Channel Average Values
as well as significant differences in the hemoglobin waveforms between the depression and bipolar disorder subjects. Bipolar disorder group Depression group Healthy control Group Comparison
(n = 14) (n = 39) (n = 24) p Value fNIRS and fMRI Comparison of
AUC 2.9±3.6 1.8±2.5 5.5±3.2 p<0.001
WC 34.2±12.8 25.3±14.8 33.9±5.2 p=0.01
Task Presentation Method
Pre-test rest (30 sec.); Recall and Japanese words beginning with "ka" (30 sec.); hemoglobin; Recall and say Japanese words Schematic View of Differences in AUC and WC Determined from
beginning with "no" (30 sec.); Post-test rest (70 sec.) Averages of Healthy, Depression, and Bipolar Disorder Groups Measurement Channel Positions Motor Control Brain Activity during
AUC Healthy
High AUC
Rest Task Rest Depression Bipolar Disorder Measurement with EEG Simultaneous
Low AUC
30 sec. Recall and say Japanese Recall and say Japanese 70 sec.
words beginning with "ka" words beginning with "no"
30 sec. 30 sec.
WC
(In Japanese, words beginning with "ka" are the most common, while words beginning with "no" are the least common.)
Early WC Late WC Analysis Method NIRS Signal
Data Analysis Method Bipolar disorder and depression were distinguished by discriminant analysis using the AUC parameter conventionally used in research
The moving-average method is used to reduce the noise components and baseline-shift correction is applied to the changes in Oxy-Hb to express overall activity and the new WC parameter that reflects the temporal activity of the cerebral cortex. Values of 0.71 sensitivity
concentration. The following two index values are calculated for the average waveform data for all 42 channels, and the p values are and 0.46 specificity were achieved in the detection of bipolar disorder.
calculated between the subject groups and healthy group.
Signal integrated value over the 60 sec. task time ((1) AUC: area under the curve) Discriminant Analysis of Bipolar Disorder Inner Speech Investigating
Time to reach half the signal integrated value during the task ((2) WC: weighted center) Disease Diagnosis
Bipolar Disorder Depression
0.02 Discriminant Bipolar Disorder 10 21
Analysis Depression 4 18
0.015 Functions Language Processing
These results suggest that even a diagnosis of long-term depression may occasionally be altered to a diagnosis of bipolar disorder.
0.01 Applying the task presentation method and data analysis method introduced here to fNIRS measurements may provide an effective
Corrected
Before correction monitoring tool for brain function evaluations related to mental disorders in the future.
0.005
AUC; area Correction
AUC; area
under curve
under curve (Data supplied by: Shinji Shimodera, MD, PhD, Department of Neuropsychiatry, Kochi Medical School, Kochi University) Research Mental Disorder
0 Reference: Shimodera, S., Imai, Y., Kamimura, N., Morokuma, I., Fujita, H., Inoue, S., Furukawa, T. A. (2012).
0.22 4.62 9.17 13.42 17.82 22.22 28.62 31.62 35.42 39.82 44.22 48.62 53.02 57.42 61.82 66.22 70.62 75.02 79.42 63.82 88.22 92.01 97.02 101.42 105.82 110.22 114.82 119.02 123.42 127.87 132.22 136.62 141.02 145.42 149.87 164.22 “Near-infrared spectroscopy of bipolar disorder may be distinct from that of unipolar depression and of healthy controls.” 4(4): 258-265.
-0.005
Start task Complete task
WC (weighted center): Time to reach half the signal integrated value Shimadzu fNIRS Key References Regarding
Meaning of AUC and WC Indexes
20 21