
Page 12 - Shimadzu-MassSpectrometerCatalog
P. 12
Software LCMS-2020
LabSolutions LCMS
L a b S o l u t
LabSolutions LCMS is workstation software used for LCMS system
control and data processing.
LabSolutions LCMS is operated in the same manner as LCsolution,
GCsolution, and GCMSsolution, which means even an inexperi-
enced operator can do everything from making instrument tuning to
setting analytical conditions, viewing or analyzing data, and prepar-
ing reports easily.
The mass spectrometer can be operated in the same manner as ab-
sorption or fluorescence detectors.
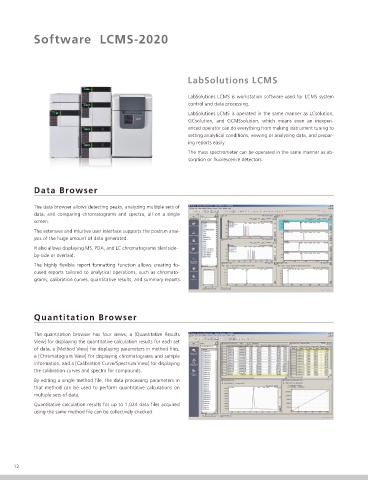
Data Browser
The data browser allows detecting peaks, analyzing multiple sets of
data, and comparing chromatograms and spectra, all on a single
screen.
The extensive and intuitive user interface supports the postrun anal-
ysis of the huge amount of data generated.
It also allows displaying MS, PDA, and LC chromatograms tiled side-
by-side or overlaid.
The highly flexible report formatting function allows creating fo-
cused reports tailored to analytical operations, such as chromato-
grams, calibration curves, quantitative results, and summary reports.
Quantitation Browser
The quantitation browser has four views; a [Quantitative Results
View] for displaying the quantitative calculation results for each set
of data, a [Method View] for displaying parameters in method files,
a [Chromatogram View] for displaying chromatograms and sample
information, and a [Calibration Curve/Spectrum View] for displaying
the calibration curves and spectra for compounds.
By editing a single method file, the data processing parameters in
that method can be used to perform quantitative calculations on
multiple sets of data.
Quantitative calculation results for up to 1,024 data files acquired
using the same method file can be collectively checked.
12