
Page 19 - Cannabis&Hemp Industrial-Hemp-Brochure
P. 19
Roots: Nutrients & Contaminants
Energy Dispersive X-Ray Fluorescence Spectrometry (EDXRF)
Quantitative (%) Analysis of Nutrients & Heavy Metals
The health of the hemp plant is determined by environmental conditions such as soil,
water, and air, as well as additives for plant health and growth. There are twenty essential
macronutrients and micronutrients for the plant to grow properly. In the “Flower: QA/QC
Testing” section of this brochure, the flower is tested for contaminants such as arsenic (As),
cadmium (Cd), lead (Pb), mercury (Hg), other heavy metals and nutrients by Inductively
Coupled Plasma-Mass Spectrometry (ICP-MS) because hemp plants are bio-accumulators.
The soil, roots and plant’s health and growth products can also be tested by ICP-MS, but
there is a time-consuming sample preparation step requiring dissolving the sample by acid-
assisted microwave oven digestion.
With Shimadzu’s Energy Dispersive X-Ray Fluorescence Spectrometer (EDX-7000), there is little or no sample preparation
with analysis complete in a few minutes. Once the EDX-7000 has been programmed, it may be operated by a layperson.
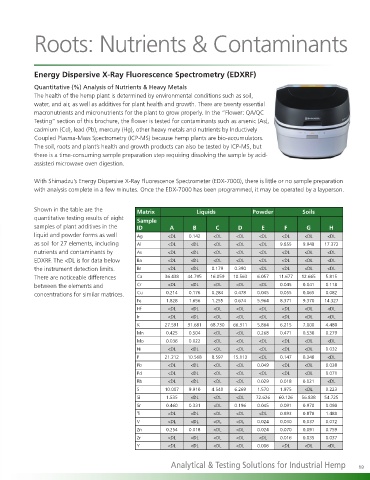
Shown in the table are the Matrix Liquids Powder Soils
quantitative testing results of eight Sample
samples of plant additives in the ID A B C D E F G H
liquid and powder forms as well Ag <DL 0.142 <DL <DL <DL <DL <DL <DL
as soil for 27 elements, including Al <DL <DL <DL <DL <DL 9.855 9.948 17.372
nutrients and contaminants by As <DL <DL <DL <DL <DL <DL <DL <DL
EDXRF. The <DL is for data below Ba <DL <DL <DL <DL <DL <DL <DL <DL
the instrument detection limits. Br <DL <DL 0.179 0.390 <DL <DL <DL <DL
There are noticeable differences Ca 36.438 44.795 16.059 10.563 6.057 11.677 12.665 5.815
between the elements and Cr <DL <DL <DL <DL <DL 0.045 0.041 0.118
concentrations for similar matrices. Cu 0.214 0.176 0.284 0.478 0.045 0.055 0.065 0.082
Fe 1.828 1.656 1.255 0.674 5.964 8.371 9.370 14.327
Hf <DL <DL <DL <DL <DL <DL <DL <DL
Ir <DL <DL <DL <DL <DL <DL <DL <DL
K 27.591 31.681 68.730 66.311 5.864 6.215 7.000 4.480
Mn 0.425 0.504 <DL <DL 0.268 0.471 0.538 0.279
Mo 0.036 0.022 <DL <DL <DL <DL <DL <DL
Ni <DL <DL <DL <DL <DL <DL <DL 0.032
P 21.212 10.568 8.597 15.113 <DL 0.147 0.348 <DL
Pb <DL <DL <DL <DL 0.049 <DL <DL 0.038
Pd <DL <DL <DL <DL <DL <DL <DL 0.071
Rb <DL <DL <DL <DL 0.029 0.018 0.021 <DL
S 10.007 9.910 4.540 6.269 1.570 1.975 <DL 0.223
Si 1.535 <DL <DL <DL 72.626 60.126 56.838 54.725
Sr 0.460 0.331 <DL 0.196 0.045 0.091 0.970 0.080
Ti <DL <DL <DL <DL <DL 0.893 0.878 1.488
V <DL <DL <DL <DL 0.024 0.030 0.037 0.072
Zn 0.254 0.018 <DL <DL 0.024 0.070 0.091 0.759
Zr <DL <DL <DL <DL <DL 0.016 0.035 0.037
Y <DL <DL <DL <DL 0.006 <DL <DL <DL
Analytical & Testing Solutions for Industrial Hemp 19