
Page 23 - Shimadzu Journal vol.9 Issue1
P. 23
Clinical Research
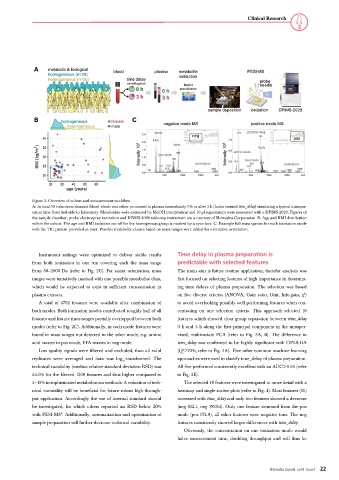
Figure 2. Overview of cohort and measurement workflow.
A: In total 50 volunteers donated blood which was either processed to plasma immediately 0 h or after 3 h (factor termed time_delay) simulating a typical transpor-
tation time from bed-side to laboratory. Metabolites were extracted by MeOH precipitation and 10 µl supernatant were measured with a DPiMS-2020. Figures of
the sample chamber, probe electrospray ionization and DPiMS-2020 table-top instrument are a courtesy of Shimadzu Corporation. B: Age and BMI distribution
within the cohort. The age and BMI inclusion cut-off for the homogenous group is marked by a cyan box. C: Example full mass spectra for each ionization mode
with the TIC pattern provided as inset. Possible metabolite classes based on mass ranges were added for a tentative orientation.
Instrument settings were optimized to deliver stable results Time delay in plasma preparation is
from both ionization in one run covering each the mass range predictable with selected features
from 50–2000 Da (refer to Fig. 2C). For easier orientation, mass The main aim is future routine application, therefor analysis was
ranges were tentatively marked with one possible metabolite class, first focused on selecting features of high importance in determin-
which would be expected to exist in sufficient concentration in ing time delays of plasma preparation. The selection was based
plasma extracts. on five diverse criteria (ANOVA, Gain ratio, Gini, Info.gain, χ )
2
A total of 4702 features were available after combination of to avoid overlooking possibly well performing features when con-
both modes. Both ionization modes contributed roughly half of all centrating on one selection criteria. This approach selected 18
features and feature mass ranges partially overlapped between both features which showed clear group separation between time_delay
modes (refer to Fig. 2C). Additionally, in each mode features were 0 h and 3 h along the first principal component in the unsuper-
found in mass ranges not detected in the other mode, e.g. amino vised, multivariate PCA (refer to Fig. 3A, B). The difference in
acid masses in pos mode, FFA masses in neg mode. time_delay was confirmed to be highly significant with OPLS-DA
Low quality signals were filtered and excluded, than all valid (Q >70%, refer to Fig. 3A). Five other common machine learning
2
replicates were averaged and data was log -transformed. The approaches were used to classify time_delay of plasma preparation.
10
technical variability (median relative standard deviation RSD) was All five performed consistently excellent with an AUC>0.95 (refer
34.6% for the filtered 1200 features and thus higher compared to to Fig. 3E).
5–15% in sophisticated metabolomics methods. A reduction of tech- The selected 18 features were investigated in more detail with a
nical variability will be beneficial for future robust high-through- heatmap and single scatter plots (refer to Fig. 4). Most features (16)
put application. Accordingly the use of internal standard should increased with time_delay and only two features showed a decrease
be investigated, for which others reported an RSD below 20% (neg 812.1, neg 787.84). Only one feature stemmed from the pos
with PESI-MS . Additionally, automatization and optimization of mode (pos 974.8), all other features were negative ions. The neg
6
sample preparation will further decrease technical variability. features consistently showed larger differences with time_delay.
Obviously, the concentration on one ionization mode would
halve measurement time, doubling throughput and will thus be
22
Shimadzu Journal vol.9 Issue1 22