
Page 9 - Shimadzu SALD-2300
P. 9
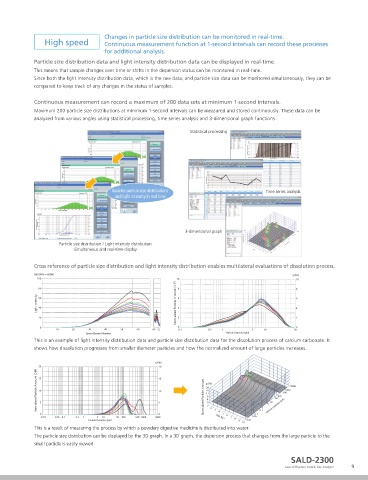
By enabling measurement under wide particle  Changes in particle size distribution can be monitored in real-time.
 High sensitivity / High concentration  concentration conditions (0.1ppm to 20%), changes  High speed  Continuous measurement function at 1-second intervals can record these processes
 in  particle size distribution depending on particle  for additional analysis.
 concentration can be evaluated.
            Particle size distribution data and light intensity distribution data can be displayed in real-time.
 Previously, the particle concentration of a sample had to be adjusted to meet the optimum conditions of analyzers by dilution or concentration using   This means that sample changes over time or shifts in the dispersion status can be monitored in real-time.
 a centrifuge. In these cases, changes in particle size distribution, such as agglomerations or dispersions, could not be considered.  Since both the light intensity distribution data, which is the raw data, and particle size data can be monitored simultaneously, they can be
            compared to keep track of any changes in the status of samples.
 Dispersions and agglomeration can be caused by dilutions.
 In some cases, dilutions can accelerate dispersions, but in other cases, they can create agglomerates.   Continuous measurement can record a maximum of 200 data sets at minimum 1-second intervals.
 To ensure optimum, the initial particle concentration must be determined without dilutions or concentrations.  Maximum 200 particle size distributions at minimum 1-second intervals can be measured and stored continuously. These data can be
 After the evaluation of particle size distribution at the initial state, the effects of particle concentration from dispersions and   analyzed from various angles using statistical processing, time series analysis and 3-dimensional graph functions.
 agglomerations must be evaluated.
                                                                Statistical processing
 Wide particle concentration range must be covered to evaluate the dissolution process of sample particles.
 This is necessary because the progress of dissolution makes the particle concentration low in comparison to the first particle concentration.

 SALD-2300 can measure particle size distribution under the conditions of particle concentration from 0.1ppm to 20%.
 When the sampler SALD-MS23 or batch cell SALD-BC23 is used, measurements are possible under conditions of concentration from 0.1ppm to
 100ppm.
 When the high-concentration sample measurement system SALD-HC23S is used, high-concentration samples up to 20% can be measured   Updates particle size distributions   Time series analysis
 because the negative effects of multiple scattering are prevented.   and light intensity in real time

 q3(%)
 30  30  Measurement without dilution of hand cream
 In the case of hand cream, dilutions make the particle size
 Normalized Particle Amount (Diff)  20  20  distribution narrow.  Particle size distribution / Light intensity distribution  3-dimensional graph
 25
 25
 Measurements without dilutions must be done to obtain
 15
 15
 accurate measurement.
                          Simultaneous and real-time display
 10
 10
 5
 5
            Cross reference of particle size distribution and light intensity distribution enables multilateral evaluations of dissolution process.
 0  0
 0.01  0.05 0.1  0.5  1  5  10  50  100  500 1000  5000  (%)100% = 60000                          q3(%)
 Particle Diameter (µm)  100                               10                                      10
 q3(%)
 Q3(%)        80                                            8                                      8
 100  20  Evaluation of a fine particle included in red wine  Light Intensity  60  Normalized Particle Amount (Diff)  6  6
 Normalized Particle Amount (Cum)  60  15 Normalized Particle Amount (Diff)  the state of the undiluted solution.  40 20 0  10  20  Sensor Element Number  50  60  68 72  4 2 0 0.1  0.5  1  Particle Diameter (µm)  5  10  50 4 2 0
 The graph to the left shows the result of measuring red wine in
 80
 The low-concentration sample can be measured as an undiluted
 10
 solution.
 40
                                    40
                              30
 Measuring it in this state can remove the influence of dispersion
 20
            shows how dissolution progresses from smaller diameter particles and how the normalized amount of large particles increases.
 0  5 0  or agglomeration by the concentration operation.  This is an example of light intensity distribution data and particle size distribution data for the dissolution process of calcium carbonate. It
 0.01  0.05 0.1  0.5  1  5  10  50  100  500 1000  5000
 Particle Diameter (µm)
 q3(%)                                              q3(%)
 30  30
 Evaluation of negative electrode material of a   20 15  20 15
 secondary battery
 25
 Normalized Particle Amount (Diff)  20  20  At left is a graph showing the results of measuring a carbon   Normalized Particle Amount (Diff)  10 5  10 5  Normalized Particle Amount  q3(%) 2  1  Particle Diameter (µm) 500 1000 5000
 25
                                                                     20
 black particle.
                                                                     16
                                                                     12
 15
 15
                                                                      8
                                                                                             100
 The agglomeration particle (micrometer range) has been
                                                                                            50
                                                                      4
                                                                                          10
                                                                      0
 10
 10
                                                                                          5
 dispersed to the fine particle (sub-micrometer range) by
                                                                     1
                                                                         4
 5
 5
                                                                           5
              0
 dispersion processing using a homogenizer. The sample (sample
                          0.5
                   0.05 0.1
               0.01
                                   10
                                 5
                            1
                              Particle Diameter (µm)  50  100  500 1000  5000 0  3  File No.  6  7  8  9  0.01  0.05 0.1  0.5
 0  0  that absorbs light like the carbon black) that doesn't transmit           10
 0.01  0.05 0.1  0.5  1  5  10  50  100  500 1000  5000
 light easily can be measured based on the improvement in
 Particle Diameter (µm)  This is a result of measuring the process by which a powdery digestive medicine is distributed into water.
            The particle size distribution can be displayed by the 3D graph. In a 3D graph, the dispersion process that changes from the large particle to the
 sensitivity.
            small particle is easily viewed.
                                                                                                 SALD-2300
 8                                                                                             Laser Diffraction Particle Size Analyzer  9