
Page 13 - Shimadzu IG-1000 Plus
P. 13
Powerful Functions Support Measurement
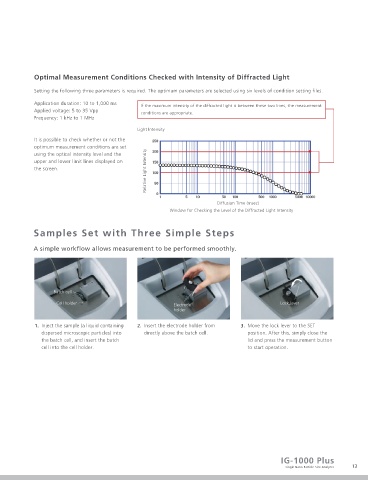
Applying Data on Changes in the Intensity of Optimal Measurement Conditions Checked with Intensity of Diffracted Light
Diffracted Light (Decay Process) Setting the following three parameters is required. The optimum parameters are selected using six levels of condition setting files.
In addition to the measurement results for particle size distributions, data on changes in the Application duration: 10 to 1,000 ms If the maximum intensity of the diffracted light is between these two lines, the measurement
Applied voltage: 5 to 35 Vpp
intensity of diffracted light (i.e., the decay process) can also be used. This data can be output to Frequency: 1 kHz to 1 MHz conditions are appropriate.
Excel, allowing users to try out their own analytical techniques.
Light Intensity
It is possible to check whether or not the
optimum measurement conditions are set
Relative Light Intensity
using the optical intensity level and the
upper and lower limit lines displayed on
the screen.
Diffusion Time (msec)
Window for Checking the Level of the Diffracted Light Intensity
Samples Set with Three Simple Steps
A simple workflow allows measurement to be performed smoothly.
Batch cell
Window of Wing-1 Control Software
Cell holder Electrode Lock lever
holder
Measurement Results Validated Using Changes in the Intensity of Diffracted Light
(Decay Process) 1. Inject the sample (a liquid containing 2. Insert the electrode holder from 3. Move the lock lever to the SET
dispersed microscopic particles) into directly above the batch cell. position. After this, simply close the
If the particles are relatively small, the attenuation gradient is relatively high, whereas if the particles are relatively large, the the batch cell, and insert the batch lid and press the measurement button
attenuation gradient is relatively small. This means that the relative (average) sizes of particles can be ascertained at a glance. cell into the cell holder. to start operation.
Particle Size Light Intensity
1 5 nm
2 8 nm
3 18 nm 7
4 28 nm Relative Light Intensity 6
5 46 nm 5
6 60 nm 1 2 3 4
7 100 nm Diffusion Time (msec)
Comparison of Attenuation in Intensities of Diffracted Light
IG-1000 Plus
12 Single Nano Particle Size Analyzer 13