
Page 8 - Shimadzu HITS-X Series
P. 8
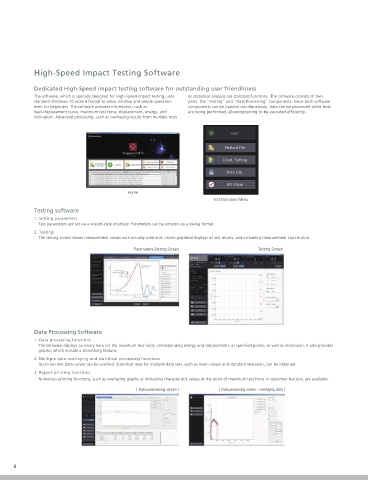
High-Speed Impact Testing Software


            Dedicated High-Speed impact testing software for outstanding user friendliness
            The software, which is specially designed for High-Speed impact testing, uses   or statistical analysis are standard functions. The software consists of two
            standard Windows 10 wizard format to allow intuitive and simple operation   parts: the “Testing” and “Data Processing” components. Since both software
            even for beginners. The software provides information such as   components can be opened simultaneously, data can be processed while tests
            load-displacement curve, maximum test force, displacement, energy, and   are being performed, allowing testing to be executed ef ciently.
            inclination. Advanced processing, such as overlaying results from multiple tests


                                           Home
                                                                        Test Execution Menu
            Testing software
            1. Setting parameters
              Test parameters are set via a wizard-style interface. Parameters can be entered via a dialog format.
            2. Testing
              The testing screen shows measurement values with actually used and, online graphical displays of test results, and includes a measurement start button.
                                             Parameters Setting Screen                 Testing Screen


            Data Processing Software
            1. Data processing functions
              The software displays summary data for the maximum test force, corresponding energy and displacement, at speci ed points, as well as inclination. It also provides
              graphs, which include a smoothing feature.
            2. Multiple data overlaying and statistical processing functions
              Up to ten test data curves can be overlaid. Statistical data for multiple data sets, such as mean values and standard deviation, can be obtained.
            3. Report printing functions
              Numerous printing functions, such as overlaying graphs or indicating characteristic values at the point of maximum test force or specimen fracture, are available.
                                              [ Data processing screen ]  [ Data processing screen – overlaying data ]


      8