
Page 7 - Shimadzu DPiMS QT
P. 7
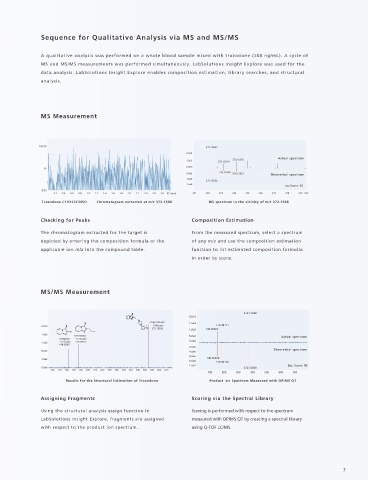
Sequence for Qualitative Analysis via MS and MS/MS


               A qualitative analysis was performed on a whole blood sample mixed with trazodone (500 ng/mL). A cycle of
               MS and MS/MS measurements was performed simultaneously. LabSolutions Insight Explore was used for the
               data analysis. LabSolutions Insight Explore enables composition estimation, library searches, and structural
               analysis.


               MS Measurement


              100.00                                                 372.15837
                                                               2.0e3
                                                                                             Actual spectrum
                                                               1.0e3     373.16214  374.15576
                                                               0.0e0
                %
                                                               5.0e5      373.16145  374.15627  Theoretical spectrum
                                                               1.0e6
                                                                     372.15856
                                                               1.5e6
                                                                                                Iso Score: 87
               0.00
                   0.2  0.4  0.6  0.8  1.0  1.2  1.4  1.6  1.8  2.0  2.2  2.4  2.6  2.8  RT (min)  371  372  373  374  375  376  377  378  379  m/z
               Trazodone C19H22ClN5O        Chromatogram extracted at m/z 372.1586  MS spectrum in the vicinity of m/z 372.1586
               Checking for Peaks                                Composition Estimation

               The chromatogram extracted for the target is      From the measured spectrum, select a spectrum
               depicted by entering the composition formula or the   of any m/z and use the composition estimation
               applicable ion m/z into the compound table.       function to list estimated composition formulas
                                                                 in order by score.


               MS/MS Measurement


                                                                                  372.15838
                                                                2.0e3
                                                   C19H23N5OCl  1.5e3
               2.0e3                                -0.48 ppm            176.08171
                                                   372.15838    1.0e3  148.05007
               1.6e3
                          C9H10N3O                              5.0e2                         Actual spectrum
                     C7H6N3O  -0.74 ppm
               1.2e3  -3.17 ppm  176.08171                      0.0e0
                     148.05007
                                                                2.0e6
               8.0e2                                            4.0e6                       Theoretical spectrum
                                                                6.0e6
               4.0e2                                                 148.05030
                                                                8.0e6    176.08170
                                                                1.0e7                           Lib. Score: 96
               0.0e0                                                              372.15840
                  100  120  140  160  180  200  220  240  260  280  300  320  340  360  380  400  420
                                                                      100  200  300  400  500  600  700
                       Results for the Structural Estimation of Trazodone  Product Ion Spectrum Measured with DPiMS QT
               Assigning Fragments                               Scoring via the Spectral Library
               Using the structural analysis assign function in   Scoring is performed with respect to the spectrum
               LabSolutions Insight Explore, fragments are assigned   measured with DPiMS QT by creating a spectral library
               with respect to the product ion spectrum.         using Q-TOF LC/MS.


                                                                                                                   7