
Page 5 - Shimadzu DPiMS QT
P. 5
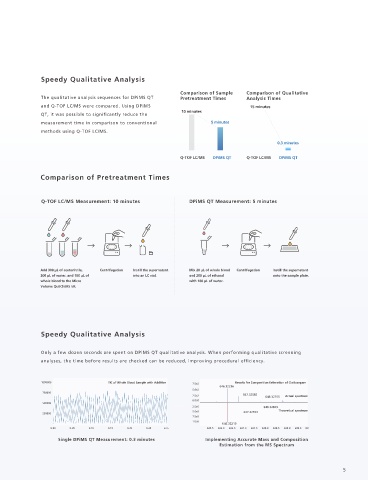
Speedy Qualitative Analysis

                                                             Comparison of Sample  Comparison of Qualitative
               The qualitative analysis sequences for DPiMS QT   Pretreatment Times  Analysis Times
               and Q-TOF LC/MS were compared. Using DPiMS                           15 minutes
                                                             10 minutes
               QT, it was possible to significantly reduce the
               measurement time in comparison to conventional          5 minutes
               methods using Q-TOF LC/MS.
                                                                                             0.3 minutes

                                                             Q-TOF LC/MS  DPiMS QT  Q-TOF LC/MS  DPiMS QT


              Comparison of Pretreatment Times


               Q-TOF LC/MS Measurement: 10 minutes              DPiMS QT Measurement: 5 minutes


              Add 300 µL of acetonitrile,  Centrifugation  Instill the supernatant  Mix 20 µL of whole blood  Centrifugation  Instill the supernatant
              200 µL of water, and 100 µL of  into an LC vial.  and 200 µL of ethanol      onto the sample plate.
              whole blood to the Micro                          with 180 µL of water.
              Volume QuEChERS kit.


               Speedy Qualitative Analysis


               Only a few dozen seconds are spent on DPiMS QT qualitative analysis. When performing qualitative screening
               analyses, the time before results are checked can be reduced, improving procedural efficiency.


               1000000               TIC of Whole Blood Sample with Additive  7.5e2  Results for Composition Estimation of Clotiazepam
                                                                          646.32236
                                                                 5.0e2
               750000
                                                                 2.5e2            647.32582  648.32755  Actual spectrum
                                                                 0.0e0
               500000
                                                                 2.5e5                  648.32829
                                                                 5.0e5            647.32553  Theoretical spectrum
               250000
                                                                 7.5e5
                                                                 1.0e6
                                                                           646.32219
                  0.00  0.05  0.10   0.15  0.20  0.25  min            645.5  646.0  646.5  647.0  647.5  648.0  648.5  649.0  649.5  m/z
                    Single DPiMS QT Measurement: 0.3 minutes         Implementing Accurate Mass and Composition
                                                                          Estimation from the MS Spectrum
                                                                                                                   5