
Page 3 - LifeScience Multi-Omics Analysis Package
P. 3
The Multi-omics Analysis Package, developed for metabolic engineering applications, provides the ability to Data Analysis Example
automatically generate metabolic maps and perform a variety of data analysis for the vast data generated in elds
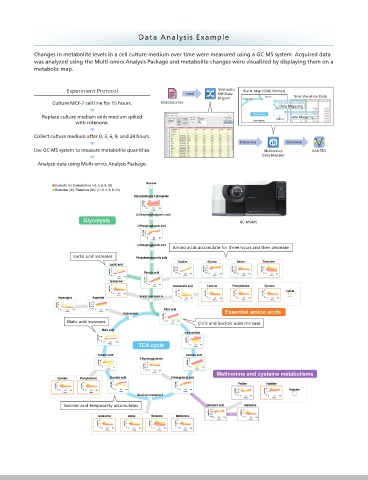
like metabolomics, proteomics and ux analysis. It offers a powerful platform to support drug discovery, Changes in metabolite levels in a cell culture medium over time were measured using a GC-MS system. Acquired data
bioengineering and other life science research applications.
was analyzed using the Multi-omics Analysis Package and metabolite changes were visualized by displaying them on a
metabolic map.
Automatically Visualize Quantitative Changes in Metabolites and Proteins on a
Metabolic Map Experiment Protocol Load Shimadzu Blank Map (GML format)
MS Data
Dramatically reduces the amount of work required for bottleneck processes of analyzing and visualizing data, Import Time Variation Data
such as displaying data on a metabolic map and analyzing correlations. Culture MCF-7 cell line for 15 hours. Metabolomes Data Mapping
Works Perfectly with Software Developed by the World's Top Research Institutions Replace culture medium with medium spiked Data Mapping
with rotenone.
In combination with various other software (called gadgets) connected on the GARUDA platform, it offers
™
optimal work ows for multi-dimensional analyses. Collect culture medium after 0, 3, 6, 9, and 24 hours.
Discovery Discovery
Integrated Support for Operations from Data Acquisition to Analysis Use GC-MS system to measure metabolite quantities. Multiomics VANTED
The software includes various data processing gadgets which connect with corresponding data analysis gadgets, Data Mapper
providing a seamless, connected experience of a single software program. Analyze data using Multi-omics Analysis Package.
It is designed to work in combination with various Shimadzu databases prepared with "Ready-to-Use Methods"
for everything from sample pretreatment to analytical conditions, which ensures the entire process ow, from
obtaining mass spectrometer measurements to data analysis, can be performed smoothly.
GC-MS/MS
Q-TOF LCMS LC-MS/MS GC-MS/MS
Amino acids accumulate for three hours and then decrease
Multi-omics Data Pathway Data
Visualization of Correlations Metabolome Fluxome Proteome Transcriptome Metabolite ID Reactions Lactic acid increases
G6P ←→ F6P
Text data les
C00041
Correlation Shimadzu MS Blank GML
Coef cient Data Import Generator
Calculator
Malic acid increases
Multiomics Citric and isocitric acids increase
Volcano Plot
Cytoscape Data
Generator
Mapper
VANTED
Succinic acid temporarily accumulates
Comparison of Acquired Data Automatic Visualization on a Metabolic Map