
Page 15 - Application Handbook - Liquid Chromatography
P. 15
2. Experimental
2. Experimental 2-5. Detection 3-1. Tryptic Mapping and MS Characterization The acquired mass spectrometry data were manually processed, by
averaging the number of scans within each chromatographic peak,
2-1. Instrument PDA wavelength: 215 nm; sampling rate 12.5 Hz; time constant 0.080 The contour plot obtained for the comprehensive RP-LC×RP-LC–PDA– and deconvolution of charge envelope was afterwards performed
sec. LCMS-IT-TOF: ESI positive mode; ow from the LC system 180 L/min; IT-TOF analysis of α-casein and dephosphorylated α-casein is shown in for [M+H] and [M+nH] n+ ions. The corresponding window of the
+
• Shimadzu CBM-20A controller detector voltage 1.60 kV; CDL temperature 200 °C; block heater Fig. 2. Replicate analyses (n =3) of the digests were run on the 2D system, LCMSsolution software is shown in Fig. 7.
• Shimadzu LC-20AD dual-plunger parallel- ow pumps (D1-LC) temperature 200 °C; nebulizing gas ow (N 2 ) 1.5 L/min; ion accumu- and reproducibility of the retention times was calculated for ve selected
lation time 40 msec; full scan 200–2000 m/z; repeat 3; ASC 70%. peaks spread throughout the elution window, yielding an average CV%
• Shimadzu LC-20AB solvent delivery module (D2-LC)
of 0.555 (averaged CV% in the two chromatographic dimensions).
• Shimadzu DGU-20A5 degassing unit The overall peak capacity of the comprehensive separation was calcu-
• Shimadzu CTO-20A column oven 2-6. Sample Preparation lated as 8540, being multiplicative of the individual values obtained for
• Shimadzu SIL-20A autosampler Tryptic digestion was made according to Bushey and Jorgeson : the two dimensions (n 1 × n 2 ). These values are merely theoretical, how-
[ 7]
• Shimadzu SPD-M20A photo diode array detector (8 L ow cell) one-tenth gram of α-casein or dephosphorylated α-casein were ever, any effect of the rst dimension undersampling (about 1 fraction
dissolved in 10 mL of 0.01 M HCOONH 4 buffer, and the pH adjusted per peak capacity), nor the selectivity correlation (orthogonality), or the
• Shimadzu LCMS-IT-TOF (ESI source)
to 8.0 with NH 4 OH; the solution was heated in a boiling water bath retention window in both dimensions, which does not cover the whole
For connecting the two dimensions: electronically-controlled 2-posi- for 6 min. After the solution cooled, 2.0 mg of trypsin from bovine gradient duration. Therefore, some adjustments were made, in the cal-
tion, ten-port high pressure switching valve (with two 100 L sam- pancreas was added, and the mixture was allowed to react for 4 h at culation, which are fundamental for realistic peak capacity calculations.
pling loops), Fig. 3. +37 °C; the reaction was quenched by adding 0.1% TFA to pH 2. The First, the practical peak capacity of the separation, which accounts for or- Fig. 6 Five-minute TIC from the RP-LC×RP-LC–PDA–IT-TOF separation
digests were stored at +4 °C, and ltered prior to injection through thogonality between the two dimensions (retention correlation derived of α-casein tryptic digest
0.45 m nylon membrane (Whatman). from solute retention vectors), was calculated using the equation devel-
2-2. Software [8] The experimental deconvoluted molecular masses of the peptides
Aqueous solutions of the peptide standard mixture were prepared at oped by Liu et al. . This calculation is based on solute retention param- were then compared to the theoretical values obtained by in-silico di-
• Shimadzu LCMSsolution (Version 3.50.346) 100 ppm. eters and, therefore, is more accurate in describing resolving power than gestion of the proteins, to obtain the relative sequence coverage.
those calculated by the multiplicative rule. A value of 3982 was obtained.
In-silico digestion of α-casein and dephosphorylated α-casein was
For the quantitative estimation of the undersampling effect, a very recent
2-3. 2D Software approach developed by Carr’s research group was employed , which also performed by using PeptideMass software available at Expasy site
3. Results and Discussion (www.expasy.ch/tools/peptide-mass.html), selecting up to three
[9]
• ChromSquare (Version 2.0) from Chromaleont, Messina, Italy accounts for the effective retention time window and the second dimen- missed cleavages (MC) for the generation of peptides.
Parameters for MS detection were optimized using a mixture of ve sion gradient time. By applying such a calculation, the peak capacity calcu-
standard peptides, and the results in terms of mass accuracy are re- lated for the 2D-LC system was further halved, yielding a value of 1802. For each identied peptide, monoisotopic molecular masses of the
ported in Table 1. The chromatographic separation was rst opti- phosphorylated and the corresponding dephosphorylated forms are re-
mized in the two dimensions, separately. In order to enhance the sep- ported, together with the position of the modied aminoacidic residues
aration power, four narrow-bore columns have been serially coupled BLOB # 21 (phosph. site). Many of the differences in the plots in Fig. 2 are obvi-
in the D1, achieving a theoretical peak capacity of 402. Peptides were ously related to the presence or absence of phosphorylated peptides.
eluted from the rst dimension with basic mobile phase (pH 9). Since phosphorylation occurs on the serine residue, and a difference
of (roughly) 80 Da was observed for removal of each phosphate
Table 1 Mass accuracy for the LCMS-IT-TOF analysis of a standard group, it must be conclusive that only HPO 3 is removed by dephos-
−
peptide mixture phorylation, leaving the serine residue intact.
Monoisotopic Predicted Measured Error Error By combining the results obtained from the two RP-LC dimensions,
AA sequence
mass [M+H] + [M+H] + (amu) (ppm) sequence coverage of 90.3% and 76.3% for α-casein and dephos-
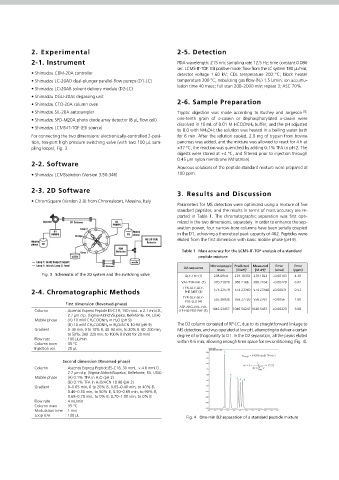
Fig. 3 Schematic of the 2D system and the switching valve GLY-TYR (1) 238.0954 239.10333 239.1023 −0.00103 4.30 phorylated α-casein, respectively, were obtained. Comparison with
Fragment T16
VAL-TYR-VAL (2) 370.21079 380.2186 380.2164 −0.00229 6.02 the corresponding values of 68.2% and 56.4% obtained for the
TYR-GLY-GLY- 573.22579 574.23369 574.23340 +0.00031 0.53 phospho monodimensional system (D1, four coupled columns) clearly demon-
2-4. Chromatographic Methods PHE-MET (3) TVDMESTEVFTK
TYR-GLY-GLY- 555.26936 556.27726 556.2767 −0.0056 1.00 strates the usefulness of the 2D-LC system.
PHE-LEU (4)
First dimension (Reversed-phase) Identied peptides in α-casein tryptic digest are shown in the plot in
ASP-ARG-VAL-TYR-
Column : Ascentis Express Peptide ES-C18, 150 mmL. × 2.1 mmI.D., ILE-HIS-PRO-PHE (5) 1045.53457 1046.54247 1046.5457 +0.00323 3.08 Fig. 8.
2.7 µm d.p. (Sigma-Aldrich/Supelco, Bellefonte, PA, USA)
Mobile phase : (A) 10 mM CH 3 COONH 4 in H 2 O (pH 9)
(B) 10 mM CH 3 COONH 4 in H 2 O/ACN 10:90 (pH 9) The D2 column consisted of RP-LC, due to its straightforward linkage to Fig. 5 ChromSquare software window showing an expansion of the α-casein
Gradient : 0–40 min, 0 to 10% B, 40–60 min, to 20% B, 60–200 min, MS detection, and was operated at low pH, attempting to deliver a certain 2D plot and the MS (ESI pos) spectrum of a phosphorylated peptide
to 50%, 200–220 min, to 100% B (hold for 20 min) degree of orthogonality to D1. In the D2 separation, all the peaks eluted
Flow rate : 100 µL/min within 0.6 min, allowing enough time space for re-conditioning (Fig. 4).
Column oven : 35 °C In Fig. 5 is depicted the ChromSquare software window for qualitative/
Injection vol. : 20 µL
quantitative data analysis, showing an enlargement from the contour
plot of Fig. 2. The lower window allows visualization of the whole
Second dimension (Reversed-phase) modulation, while integration of some peaks in the selected region of
Column : Ascentis Express Peptide ES-C18, 30 mmL. × 4.6 mmI.D., interest further allows calculation of retention times in the two dimen-
2.7 µm d.p. (Sigma-Aldrich/Supelco, Bellefonte, PA, USA) sions, as well as peak area calculation for distinctive fragments.
Mobile phase : (A) 0.1% TFA in H 2 O (pH 2)
(B) 0.1% TFA in H 2 O/ACN 10:90 (pH 2) Fig. 6 shows a ve-minute enlargement of the raw RP-LC×RP-LC–
Gradient : 0–0.05 min, 0 to 20% B, 0.05–0.40 min, to 40% B, PDA–IT-TOF chromatogram corresponding to the plot in Fig. 2, and
0.40–0.50 min, to 50% B, 0.50–0.69 min, to 90% B, the average mass spectrum obtained for three consecutive peaks (1
0.69–0.70 min, to 0% B, 0.70–1.00 min, to 0% B
Flow rate : 4 mL/min min interval, corresponding to the modulation time set) are depicted
Column oven : 35 °C in the inset. This demonstrates that at least three fractions of the pep-
Modulation time : 1 min tide with m/z 747.3650 have been transferred from the rst to the
Loop size : 100 µL Fig. 4 One-min D2 separation of a standard peptide mixture second dimension of the comprehensive system. Fig. 7 LCMSsolution software window for peak deconvolution
3