
Page 7 - Shimadzu Lightway
P. 7
Measuring Photon Count Accurately Applications
Previously, a chemical actinometer was required to calculate the number of irradiated photons, Various applications using the system are described below.
but there were concerns about variability caused by the chemical actinometer adjustment (Measured by: Associate Professor Yusuke Tamaki of the Department
process. The Lightway system uses a power meter to calibrate the number of irradiated of Chemistry, Graduate School of Science and Engineering, Tokyo
™
photons and make corrections based on spectral shape prior to measuring, which prevents
variability caused by differences in skill levels. Institute of Technology)
It also features a stable and long-lasting LED irradiation light source.
Using an LED irradiation light source means reliable measurements can be obtained Using a Ru-Re Supramolecular Complex Photocatalyst to Measure
over long periods.
Photoreaction Quantum Yield of CO2 Reduction Reaction
100
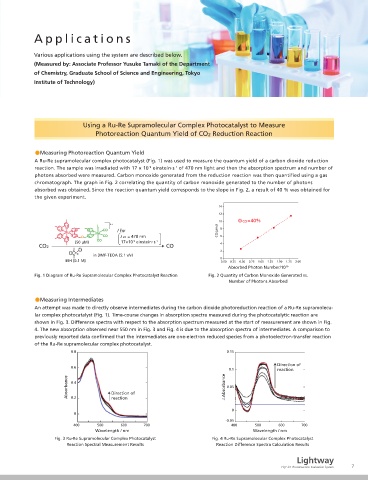
●Measuring Photoreaction Quantum Yield
Intensity decreases A Ru-Re supramolecular complex photocatalyst (Fig. 1) was used to measure the quantum yield of a carbon dioxide reduction
during measurements.
Relative Intensity Recommended Reliable measurements reaction. The sample was irradiated with 17 × 10 einstein·s of 470 nm light and then the absorption spectrum and number of
-1
-9
photons absorbed were measured. Carbon monoxide generated from the reduction reaction was then quanti ed using a gas
chromatograph. The graph in Fig. 2 correlating the quantity of carbon monoxide generated to the number of photons
service life
the given experiment.
Replacement absorbed was obtained. Since the reaction quantum yield corresponds to the slope in Fig. 2, a result of 40 % was obtained for
LED
Xenon lamp 14
0 1000 2000 3000 4000 5000
Time (hr.) 12
The gure above illustrates one example of how light source intensity decreases over time. The red line indicates the intensity of an n+ 10 ФCO=40%
LED irradiation light source, whereas the blue line indicates the intensity of a xenon lamp irradiation light source. It shows that the / hv CO/µmol 8
LED irradiation light source offers high intensity for a longer time and the intensity decrease is more gradual than for the xenon lamp λex = 470 nm -1 6
-9
irradiation light source. CO2 (50 µM) 17×10 einstein・s CO 4
2
in DMF-TEOA (5:1 v/v) 0
An optional LED irradiation light source is The LED irradiation light source can be BIH (0.1 M) 0.00 0.25 0.50 0.75 1.00 1.25 1.50 19 1.75 2.00
available.* replaced easily. Absorbed Photon Number/10
Fig. 1 Diagram of Ru-Re Supramolecular Complex Photocatalyst Reaction Fig. 2 Quantity of Carbon Monoxide Generated vs.
Number of Photons Absorbed
1.2
Remove base and LED lamp from main unit.
365 nm 405 nm 460 nm 550 nm
1
●Measuring Intermediates
An attempt was made to directly observe intermediates during the carbon dioxide photoreduction reaction of a Ru-Re supramolecu-
0.8
lar complex photocatalyst (Fig. 1). Time-course changes in absorption spectra measured during the photocatalytic reaction are
a.u. 0.6 shown in Fig. 3. Difference spectra with respect to the absorption spectrum measured at the start of measurement are shown in Fig.
4. The new absorption observed near 550 nm in Fig. 3 and Fig. 4 is due to the absorption spectra of intermediates. A comparison to
0.4
previously reported data con rmed that the intermediates are one-electron reduced species from a photoelectron-transfer reaction
0.2 of the Ru-Re supramolecular complex photocatalyst.
0.8 0.15
0
300 350 400 450 500 550 600
Direction of
Wavelength (nm) 0.6
0.1 reaction
* This product is manufactured by CELL System Co., Ltd. Therefore,
Absorbance 0.2 Direction of △Absorbance 0.05
it must be purchased as an optional product. 0.4
reaction
0
0
-0.05
400 500 600 700 400 500 600 700
Wavelength / nm Wavelength / nm
Fig. 3 Ru-Re Supramolecular Complex Photocatalyst Fig. 4 Ru-Re Supramolecular Complex Photocatalyst
Install new LED lamp with base into the main unit. Reaction Spectral Measurement Results Reaction Difference Spectra Calculation Results
Lightway
6 PQY-01 Photoreaction Evaluation System 7