
Page 5 - Shimadzu Lightway
P. 5
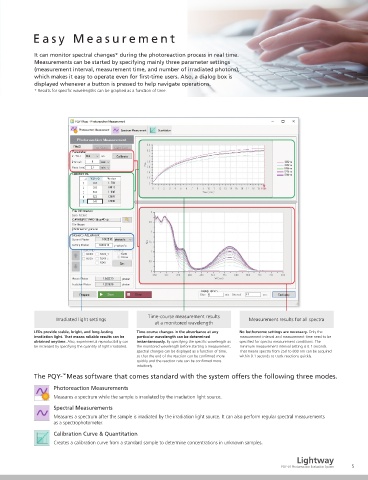
Shortening Experimental Process  Easy Measurement


 Conventional measurement requires a lengthy process using a chemical   It can monitor spectral changes* during the photoreaction process in real time.
 actinometer but Lightway  includes functionality that calibrates the   Measurements can be started by specifying mainly three parameter settings
 ™
 number of irradiated photons, eliminating this process.  (measurement interval, measurement time, and number of irradiated photons),
 *Using a chemical actinometer involves sample adjustment process steps, such as crystallizing, air   which makes it easy to operate even for  rst-time users. Also, a dialog box is
 drying, and diluting samples, and then measuring the number of photons in a dark room and   displayed whenever a button is pressed to help navigate operations.
 calibrating the number of photons irradiated on the sample.
            * Results for speci c wavelengths can be graphed as a function of time.
 About 6 hours + About 1 hour  + About 5 hours  =  Total of about 12 hours


 Irradiate light onto  Calculate number
 Conventional  Adjust chemical actinometer  sample and measure  of photons
 Method*  the change in  absorbed by
 absorbance.  sample.
 Use chemical actinometer to
 calculate number of irradiated photons.


 10min

 About 10 minutes
 Lightway
 Irradiate reaction light onto sample and
 automatically calculate the number of
 photons absorbed.

 * Conventional method requires a chemical actinometer.


 Photoreaction Quantum Yield:
 A gas chromatograph (GC) is used to measure the number
 Number of  of gas molecules generated and a liquid chromatograph
 Photoreaction  molecules generated  (LC) to measure number of liquid molecules.
 quantum yield  Number of
 Important indicator of  Photons absorbed *  Lightway accurately determines the number of photons
 absorbed by the sample, based on the number of
 photoreaction ef ciency for  photons irradiated and the absorption spectrum.
 photocatalysts, etc.
 For a comparison to data obtained with the conventional method using a chemical actinometer, refer to LAAN-A-UV-E041 Application News  Time-course measurement results
 bulletin No. A478.  Irradiated light settings      at a monitored wavelength      Measurement results for all spectra
 Application News bulletins are available from the Shimadzu website.
 * The values may not be correct if the sample has scattering properties or is absorbed by the solvent.  LEDs provide stable, bright, and long-lasting   Time-course changes in the absorbance at any   No bothersome settings are necessary. Only the
            irradiation light. That means reliable results can be   particular wavelength can be determined   measurement interval and measurement time need to be
            obtained anytime. Also, experimental reproducibility can   instantaneously. By specifying the speci c wavelength as   speci ed for spectra measurement conditions. The
            be increased by specifying the quantity of light irradiated.  the monitored wavelength before starting a measurement,   minimum measurement interval setting is 0.1 seconds.
                                              spectral changes can be displayed as a function of time,   That means spectra from 250 to 800 nm can be acquired
                                              so that the end of the reaction can be con rmed more   within 0.1 seconds to track reactions quickly.
                                              quickly and the reaction rate can be con rmed more
                                              intuitively.
            The PQY- Meas software that comes standard with the system offers the following three modes.
                      ™
                   Photoreaction Measurements
                   Measures a spectrum while the sample is irradiated by the irradiation light source.
                   Spectral Measurements
                   Measures a spectrum after the sample is irradiated by the irradiation light source. It can also perform regular spectral measurements
                   as a spectrophotometer.
                   Calibration Curve & Quantitation
                   Creates a calibration curve from a standard sample to determine concentrations in unknown samples.

                                                                                                   Lightway
 4                                                                                            PQY-01 Photoreaction Evaluation System  5