
Page 13 - Shimadzu LabSolutions IR
P. 13
LabSolutions IR
PLS Quantitation program (P/N 206-74560-91)
PLS (partial least squares) quantitation is a chemometrics method that, like
multiple linear regression analysis, is widely used for the simultaneous
quantitation of multiple components. The PLS quantitation program incorporates
PLS I and PLS II methods. It is possible to display calculation values based on input
values. PLS factors are based on "PRESS" values, loading vectors, and score values.
Analysis can be performed on the regression equations obtained with the PLS
method.
LabSolutions IR
Curve-Fitting (Peak-Splitting) program (P/N 206-74561-91)
Usually, absorption bands in infrared spectra consist of overlapping peaks. The
curve-fitting (peak-splitting) program can be used to separate absorption bands
into individual peaks, separate peaks that have been influenced by hydrogen
bonding, and identify the peaks of functional groups that are hidden by
absorption bands. Six types of curves, such as Gaussian, Lorentzian, and
Gaussian+Lorentzian, are available for separation analysis.
The curve can be selected in accordance with the form of the peaks in the
absorption band. The separated component peaks are displayed together with the
resultant spectra, making it possible to accurately evaluate the separation.
LabSolutions IR
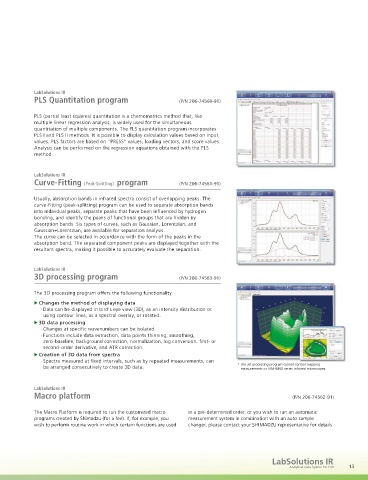
3D processing program (P/N 206-74563-91)
The 3D processing program offers the following functionality
Changes the method of displaying data
· Data can be displayed in bird's eye view (3D), as an intensity distribution or
using contour lines, as a spectral overlay, or rotated.
3D data processing
· Changes at specific wavenumbers can be isolated.
· Functions include data extraction, data points thinning, smoothing,
zero-baseline, background correction, normalization, log conversion, first- or
second-order derivative, and ATR correction.
Creation of 3D data from spectra
· Spectra measured at fixed intervals, such as by repeated measurements, can
* The 3D processing program cannot control mapping
be arranged consecutively to create 3D data. measurements or AIM-8800 series infrared microscopes.
LabSolutions IR
Macro platform (P/N 206-74562-91)
The Macro Platform is required to run the customized macro in a pre-determined order, or you wish to run an automatic
programs created by Shimadzu (for a fee). If, for example, you measurement system in combination with an auto sample
wish to perform routine work in which certain functions are used changer, please contact your SHIMADZU representative for details.
LabSolutions IR
Analytical Data System for FTIR 13