Page 4 - Shimadzu DPiMS-8060
P. 4

DPiMS  Can Be Used in Diverse Fields
                        ™


                                                                                                                                      Switch Easily Between PESI-MS and LCMS
                   Measures a Wide Variety of Samples             Applicable for a Wide Variety of Objectives
               • Body fluids, such as blood or urine                   • Detecting biological components                              The PESI TQ unit can be removed easily. The ability to exchange it with
               • Tissue sections, such as from laboratory animals or foods  • Detecting materials for chemical products               an ESI unit means measurements can be performed using the same
               • Plant materials, such as vegetables and fruits        • Detecting drugs, poisons, etc.                               theory of ionization and standard substance, which allows comparing
                                                                                                                                      data. The DPiMS-8060 was used for quantitative analysis of a forensic
                                                                                                                                      sample from a person that took the drug MT-45. As a result, we were
                                                                                                                                      able to obtain measurement data consistent with LCMS results in an
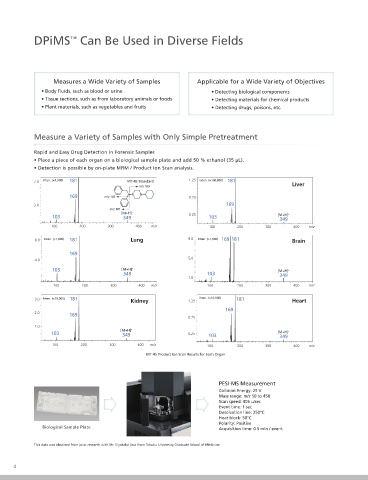
            Measure a Variety of Samples with Only Simple Pretreatment                                                                extremely short time.

            Rapid and Easy Drug Detection in Forensic Samples                                                                                       10
            • Place a piece of each organ on a biological sample plate and add 50 % ethanol (35 µL).
                                                                                                                                                     8
            • Detection is possible by on-plate MRM / Product Ion Scan analysis.                                                                                                                        PESI-MS/MS  LC-MS/MS
            7.0  Inten. (×1,000)  181      MT-45 Standard       1.25  Inten. (×100,000) 181       Liver                                              6                                     Tissue Section  (µg/mL)  (µg/mL)
                                               m/z 169                                                                                              Area ratio (sample/IS)                    Liver        4.1      3.9
                        169         m/z 103                     0.75                                                                                 4                                        Brain        1.6      1.5
            3.0                                                             169                                                                                                               Heart        1.8      2.0
                                     m/z 181                                                                                                         2            y = 0.0156x + 0.647         Lung         8.7      10.9
                                         [M+H] +                0.25                         [M+H] +                                                                R  = 0.9991              Kidney        1.7      1.5
                                                                                                                                                                     2
                  103                     349                         103                     349                                                                                        Measurement Time  0.5 min  20 min
                  100      200       300      400  m/z                100       200      300      400  m/z                                           0  0  50  100 150 200 250 300 350 400 450 500 550
                                                                                                                                                             Concentration [ng/mL]         Quantitative Results of MT-45 in Forensic Sample
                                                                                                                                                         Calibration Curve for the Drug MT-45
             8.0  Inten. (×1,000)  181      Lung               9.0  Inten. (×1,000) 169  181      Brain
                                                                                                                                      This data was obtained from joint research with Mr. Kiyotaka Usui from Tohoku University Graduate School of Medicine.
                        169
             4.0                                               5.0
                                                                                                                                      Metabolomic Analysis Performed Easily
                  103                    [M+H] +                                             [M+H] +                                  by Transferring LCMS Analytical Conditions to DPiMS Unit
                                          349                         103                     349
                                                               1.0
                   100      200       300      400  m/z               100       200      300      400  m/z
                                                                                                                                      In this example, transition information for metabolites (26 components) such
                                                                                                                                      as amino acids, organic acids, and sugars were used for metabolomic analysis   0.4  DL-2-aminobutyric acid
            3.0  Inten. (×10,000) 181       Kidney             1.25  Inten. (×10,000)  181        Heart                               of mouse livers. Metabolomes can be analyzed easily by customizing some of
                                                                            169                                                                                                                          0.2                       taurine
            2.0                                                                                                                       the analytical conditions in the LCMS primary metabolite method package.
                        169                                                                                                                                                                                       L-glutamic acid
                                                               0.75                                                                   The DPiMS-8060 system was used to measure the principal components in the   0  L-histidine
            1.0                                                                                                                       model mouse group with acute liver damage induced by carbon tetrachloride   P[2]  -0.2  L-leucine  L-proline
                                         [M+H] +                                                                                                                                                            Malic acid
                  103                     349                  0.25   103                    [M+H] +                                  and the control group. A significant difference was observed between model   -0.4  L-glutamine
                                                                                              349
                  100       200      300       400  m/z               100       200      300      400  m/z                            and control groups (given p < 0.001 for Welch's t-test), based on the significant   -0.6
                                                                                                                                      contribution of taurine to the separation of groups in the PCA loading plot.      L-ornithine
                                                 MT-45 Product Ion Scan Results for Each Organ
                                                                                                                                      The difference was verified with a box-whisker plot.               -0.8
                                                                                                                                                                                                          -0.1  0  0.1  0.2  0.3  0.4  0.5  0.6  0.7  0.8
                                                                                                                                                                                                                        p[1]
                                                                                                                                                                                                                    PCA Loading Plot
                                                                                                                                             Analyzed Components (Blue: Positive; Red: Negative)
                                                                                                                                                                                                             (c)
                                                                          PESI-MS Measurement
                                                                                                                                        3-hydroxybutyrate   citric acid    D-glucose                         5
                                                                          Collision Energy: 25 V                                        Isocitric acid      G6P            glycine
                                                                          Mass range: m/z 50 to 450                                     L-asparagine        L-aspartic acid  L-glutamic acid                 4
                                                                          Scan speed: 405 u/sec
                                                                          Event time: 1 sec                                             L-lactic acid       L-malic acid   L-serine                         Intensity (×10 6 )  3
                                                                          Desolvation line: 250°C                                       pyruvic acid        succinic acid  taurine
                                                                          Heat block: 50°C                                              2-aminobutyricacid  L-glutamine    L-histidine                       2
                                                                          Polarity: Positive                                            L-leucine/L-isoleucine  L-methionine  L-ornithine                                    ***
               Biological Sample Plate                                    Acquisition time: 0.5 min / event                             L-phenylalanine     L-proline      L-threonine                       1
                                                                                                                                        L-tryptophan        L-tyrosine
            This data was obtained from joint research with Mr. Kiyotaka Usui from Tohoku University Graduate School of Medicine.     This data was obtained from joint research with Associate Professor Kei Zaitsu from Nagoya University Graduate School of Medicine.  Box-whisker Plot of Taurine
                                                                                                                                                                                                                          DPiMS-8060
      4                                                                                                                                                                                                              Kit for Direct Probe Ionization Mass Spectrometer  5
   1   2   3   4   5   6   7   8