
Page 17 - Food&Beverages-Food Development
P. 17
Sensory Evaluation Color
Odor and taste vary significantly between individuals, and people's sensory threshold values differ depending on the component. People experience flavor not just through taste but also through their visual experience. Of all the aspects of the appearance of food
Accordingly, sensory evaluation is indispensable in evaluating the deliciousness of food products. By using equipment to products, color has the largest impact on human emotion. Even a slight difference in color can have an impact on appetite. This can
complement various types of sensory evaluation, analysis can be performed more efficiently and effectively than with sensory be expressed in terms of objective numerical values by measuring food product samples with a spectrophotometer, and then
evaluation alone. performing color calculations using the results obtained.
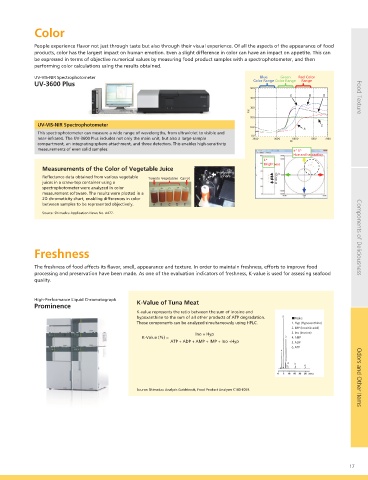
UV-VIS-NIR Spectrophotometer Blue Green Red Color
Gas Chromatograph Mass Spectrometer with a Sniffing Port UV-3600 Plus Color Range Color Range Range
GCMS-TQ8050 + the OP275 Pro Sniffing Port
Measurement of Mint
A mint sample was evaluated by the gas chromatograph mass Food Texture
spectrometer system with a sniffing port. From the results, it was
shown that a strong odor was not sensed even when large
Food Texture
amounts of limonene were contained; conversely, a strong odor
was sensed with even small amounts of skatole. This indicates that UV-VIS-NIR Spectrophotometer
there is no proportionality between the amount of a component
and the intensity of the odor. This spectrophotometer can measure a wide range of wavelengths, from ultraviolet to visible and
near-infrared. The UV-3600 Plus includes not only the main unit, but also a large-sample
compartment, an integrating sphere attachment, and three detectors. This enables high-sensitivity
Olfactory Odor Limonene Menthol measurements of even solid samples. a* b*
Intensity Hue and saturation
Octanol Skatole L*
Brightness
Gas Chromatograph Mass Spectrometer with a Sniffing Port Measurements of the Color of Vegetable Juice
Integrating
With this system, after chromatographic separation, the analyst sniffs Reflectance data obtained from various vegetable Tomato Vegetables Carrot sphere
the odor, the analyst him/herself, and the odor is detected and Toothpaste odor juices in a screw-top container using a
identified. It is used for off-flavor analysis for food products, and for Olfactory Odor Intensity spectrophotometer were analyzed in color
searches of fragrance compounds. Lemon Bar soap Fecal measurement software. The results were plotted in a
odor
odor odor 2D chromaticity chart, enabling differences in color
between samples to be represented objectively. A B C D E
Source: Shimadzu Application News No. A477.
Freshness Components of Deliciousness
functional Near-Infrared Spectroscopy System
LIGHTNIRS The freshness of food affects its flavor, smell, appearance and texture. In order to maintain freshness, efforts to improve food
processing and preservation have been made. As one of the evaluation indicators of freshness, K-value is used for assessing seafood
Components of Deliciousness
quality.
High-Performance Liquid Chromatograph K-Value of Tuna Meat
Brain Reactions to Different Sensory Stimuli Prominence
K-value represents the ratio between the sum of inosine and
It is evident that there are differences in blood flow in the brain hypoxanthine to the sum of all other products of ATP degradation. ■Peaks
depending on different sensory stimuli. Those components can be analyzed simultaneously using HPLC. 1. Hyp (Hypoxanthine)
2. IMP (Inosinic acid)
functional Near-Infrared Spectroscopy (fNIRS) System Ino + Hyp 3. Ino (Inosine)
K-Value (%) = 3 4. AMP
This instrument enables real-time visualization of the status of brain ATP + ADP + AMP + IMP + Ino +Hyp 5. ADP
surface activity by shining near-infrared light, which readily diffuses 6. ATP
through biological tissues, onto the head and then detecting a portion
of the light that is reflected as it is scattered and absorbed within the
biological body. This makes it possible to measure brain activity safely 4 5
and in a more natural state, making it application for sensory 6
evaluations of food products. Odors and Other Items
Source: Shimadzu Analysis Guidebook, Food Product Analyses C180-E059.
Odors and Other Items
16 17