Page 14 - Shimadzu Journal vol.4 Issue1
P. 14

New Energy


                                                                                    C 30H 62
                                                                                        n-C 28H 58
                                                         ᶃ                                 ʢI.S.ʣ

                                                                    ᶄ


                           50        60       70        80       90       100       110      120
                                                Fig. 1  Total Ion Current Chromatogram (EI)


                                                                                    C 30H 62


                                                         ᶃ
                                                                                        n-C 28H 58
                                                                                        ɹʢI.S.ʣ
                                                                    ᶄ

                           50        60       70        80       90       100       110      120
                                                Fig. 2  Total Ion Current Chromatogram (PCI)


                    71                                                57
                                                                       71


                       113                                               99  155
                29        141 183  239                             29           183  239
                       100     200     300     400      500              100     200      300     400     500
                         Fig. 3  Mass Spectrum (peak (1), EI)               Fig. 5  Mass Spectrum (peak (2), EI)

                         127                                                    183                   337
                                                  281                      127              337
                    71      169                                        71    155  197
                       99            281                             57  99         239
                   57         197                                                      267            338
                               211                 282                                     323
                                  239           280.0  284.4                             295      335.0  340.0
                       100     200     300     400      500              100      200     300     400     500
                         Fig. 4  Mass Spectrum (peak (1), PCI)              Fig. 6  Mass Spectrum (peak (2), PCI)
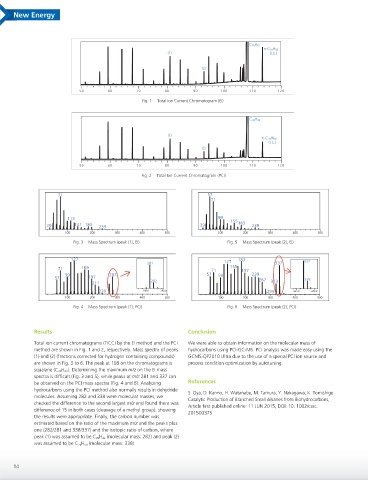


            Results                                            Conclusion
            Total ion current chromatograms (TICC) by the EI method and the PCI   We were able to obtain information on the molecular mass of
            method are shown in Fig. 1 and 2, respectively. Mass spectra of peaks   hydrocarbons using PCI-GC-MS. PCI analysis was made easy using the
            (1) and (2) (fractions corrected for hydrogen containing compounds)   GCMS-QP2010 Ultra due to the use of a special PCI ion source and
            are shown in Fig. 3 to 6. The peak at 108 on the chromatograms is   process condition optimization by autotuning.
            squalane (C 30 H 62 ). Determining the maximum m/z on the EI mass
            spectra is difficult (Fig. 3 and 5), while peaks at m/z 281 and 337 can
            be observed on the PCI mass spectra (Fig. 4 and 6). Analyzing   References
            hydrocarbons using the PCI method also normally results in dehydride
                                                               S. Oya, D. Kanno, H. Watanabe, M. Tamura, Y. Nakagawa, K. Tomishige
            molecules. Assuming 282 and 338 were molecular masses, we
                                                               Catalytic Production of Branched Small Alkanes from Biohydrocarbons,
            checked the difference to the second largest m/z and found there was
                                                               Article first published online: 11 JUN 2015, DOI: 10. 1002/cssc.
            difference of 15 in both cases (cleavage of a methyl group), showing
                                                               201500375
            the results were appropriate. Finally, the carbon number was
            estimated based on the ratio of the maximum m/z and the peaks plus
            one (282/281 and 338/337) and the isotopic ratio of carbon, where
            peak (1) was assumed to be C 20 H 42  (molecular mass: 282) and peak (2)
            was assumed to be C 24 H 50  (molecular mass: 338).


      14
   9   10   11   12   13   14   15   16   17   18   19