
Page 7 - Shimadzu UV-1900i
P. 7
High Performance to Meet Diverse Needs
Ultra-Fast Scan
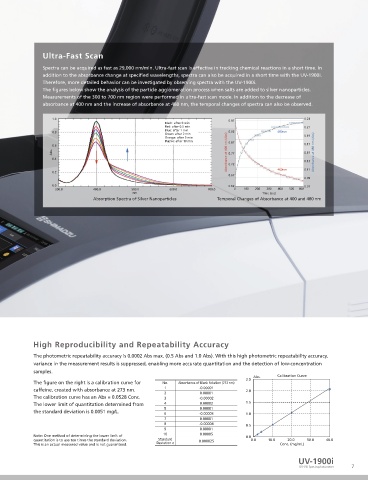
Spectra can be acquired as fast as 29,000 nm/min. Ultra-fast scan is effective in tracking chemical reactions in a short time. In
addition to the absorbance change at specified wavelengths, spectra can also be acquired in a short time with the UV-1900i.
Therefore, more detailed behavior can be investigated by observing spectra with the UV-1900i.
The figures below show the analysis of the particle agglomeration process when salts are added to silver nanoparticles.
Measurements of the 300 to 700 nm region were performed in ultra-fast scan mode. In addition to the decrease of
absorbance at 400 nm and the increase of absorbance at 480 nm, the temporal changes of spectra can also be observed.
1.0 0.97 0.23
Black: after 0 min
Red: after 0.5 min 0.21
Blue: after 1 min
0.8 0.92 480nm
Green: after 2 min 0.19
Orange: after 5 min
Purple: after 10 min 0.87
0.6 0.17
Abs. Absorbance at 400 nm (Abs) 0.77 0.15 Absorbance at 480 nm (Abs)
0.4 0.72 0.13
0.2 400nm 0.11
0.67
0.09
0.0 0.62 0.07
300.0 400.0 500.0 600.0 700.0 0 100 200 300 400 500 600
nm Time (sec)
Absorption Spectra of Silver Nanoparticles Temporal Changes of Absorbance at 400 and 480 nm
Low Stray Light High Reproducibility and Repeatability Accuracy
Abs. Calibration Curve
Stray light is at 0.5 % max. (198 nm), making accurate measurements are possible up to 3.00 The photometric repeatability accuracy is 0.0002 Abs max. (0.5 Abs and 1.0 Abs). With this high photometric repeatability accuracy,
Instrument with 1.00 % Stray Light
the vicinity of 2 Abs even in the ultraviolet region. In addition, high-concentration 2.50 UV-1900i variance in the measurement results is suppressed, enabling more accurate quantitation and the detection of low-concentration
samples can be quantified accurately. 2.00 samples.
The figure on the right is a calibration curve for acetic acid, created with absorbance at 2.5 Abs. Calibration Curve
1.50
200 nm. The figure on the right is a calibration curve for No. Absorbance of Blank Solution (273 nm)
1.00 caffeine, created with absorbance at 273 nm. 1 -0.00001 2.0
The correlation coefficient is 0.9997 and correct measured values are obtained even in 2 0.00001
the vicinity of 2 Abs. Linearity will be lost in the high absorbance region due to the 0.50 The calibration curve has an Abs = 0.0528 Conc. 3 -0.00002 1.5
The lower limit of quantitation determined from 4 0.00002
stray light. 0.00 5 0.00001
0.00 1.00 2.00 3.00 the standard deviation is 0.0051 mg/L. 6 -0.00003 1.0
Conc. (mg/L)
7 0.00001
8 -0.00004 0.5
9 0.00001
Note: One method of determining the lower limit of 10 0.00005 0.0
quantitation is to use ten times the standard deviation. Standard 0.000025 0.0 10.0 20.0 30.0 40.0
This is an actual measured value and is not guaranteed. Deviation σ Conc. (mg/mL)
UV-1900i
6 UV-VIS Spectrophotometer 7