Page 15 - Shimadzu Nexera Series
P. 15

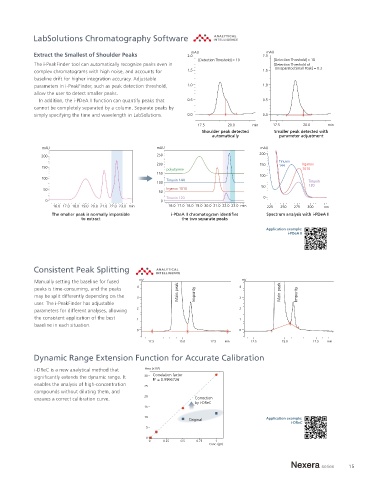
LabSolutions Chromatography Software


            Extract the Smallest of Shoulder Peaks             2.0 mAU                  2.0 mAU
                                                                   [Detection Threshold] = 10  [Detection Threshold] = 10
            The i-PeakFinder tool can automatically recognize peaks even in                 [Detection Threshold of
                                                                                             Unseparated Small Peak] = 0.3
            complex chromatograms with high noise, and accounts for   1.5               1.5
            baseline drift for higher integration accuracy. Adjustable
            parameters in i-PeakFinder, such as peak detection threshold,   1.0         1.0
            allow the user to detect smaller peaks.
              In addition, the i-PDeA II function can quantify peaks that   0.5         0.5
            cannot be completely separated by a column. Separate peaks by
            simply specifying the time and wavelength in LabSolutions.  0.0             0.0
                                                                  17.5      20.0     min   17.5      20.0     min
                                                                    Shoulder peak detected  Smaller peak detected with
                                                                       automatically         parameter adjustment
               mAU                                   mAU                               mAU
               200                                   250                               200
                                                                                             Tinuvin
                                                     200                               150           Irganox
               150                                                                           144
                                                        polystyrene                                  1010
                                                     150                               100
               100                                      Tinuvin 144
                                                     100                                               Tinuvin
                                                                                        50             120
               50                                       Irganox 1010
                                                      50
                                                        Tinuvin 120                     0
                0                                     0
                   16.0 17.0 18.0 19.0 20.0 21.0 22.0 23.0 min  16.0 17.0 18.0 19.0 20.0 21.0 22.0 23.0 min  225  250  275  300  nm
                  The smaller peak is normally impossible  i-PDeA II chromatogram identifies  Spectrum analysis with i-PDeA II
                            to extract                       the two separate peaks
                                                                                         Application example:
                                                                                                i-PDeA II


            Consistent Peak Splitting

            Manually setting the baseline for fused   mV                         mV
            peaks is time-consuming, and the peaks   4      Main peak           4             Main peak
            may be split differently depending on the   3         Impurity      3                  Impurity
            user. The i-PeakFinder has adjustable
            parameters for different analyses, allowing   2                     2
            the consistent application of the best   1                          1
            baseline in each situation.
                                              0                                 0
                                                  12.5      15.0       17.5  min    12.5      15.0       17.5  min

            Dynamic Range Extension Function for Accurate Calibration

            i-DReC is a new analytical method that   Area (×10 6 )
            significantly extends the dynamic range. It   30  Correlation factor
                                                    R  = 0.9996726
                                                    2
            enables the analysis of high-concentration  25
            compounds without diluting them, and
            ensures a correct calibration curve.  20              Correction
                                                                  by i-DReC
                                                 15
                                                 10                                      Application example:
                                                                Original
                                                                                                 i-DReC
                                                 5
                                                 0
                                                  0    0.25  0.5  0.75  1
                                                                      Conc. (g/L)


                                                                                                                     15
   10   11   12   13   14   15   16