


")


Shimadzu UV-Vis makes your work faster and easier.
- Simple Easy to use for everyone
Shimadzu’s simple design enables both first-time users and daily users to perform operations with confidence. - Smart Optimize quality control
Automatically determines the quality of the spectrum.
Provides strong support for quality control operations. - Seamless Easy transfer of measurement data
Automatically outputs text file and transfers data to Excel®. Easy to analyze measurement data with other
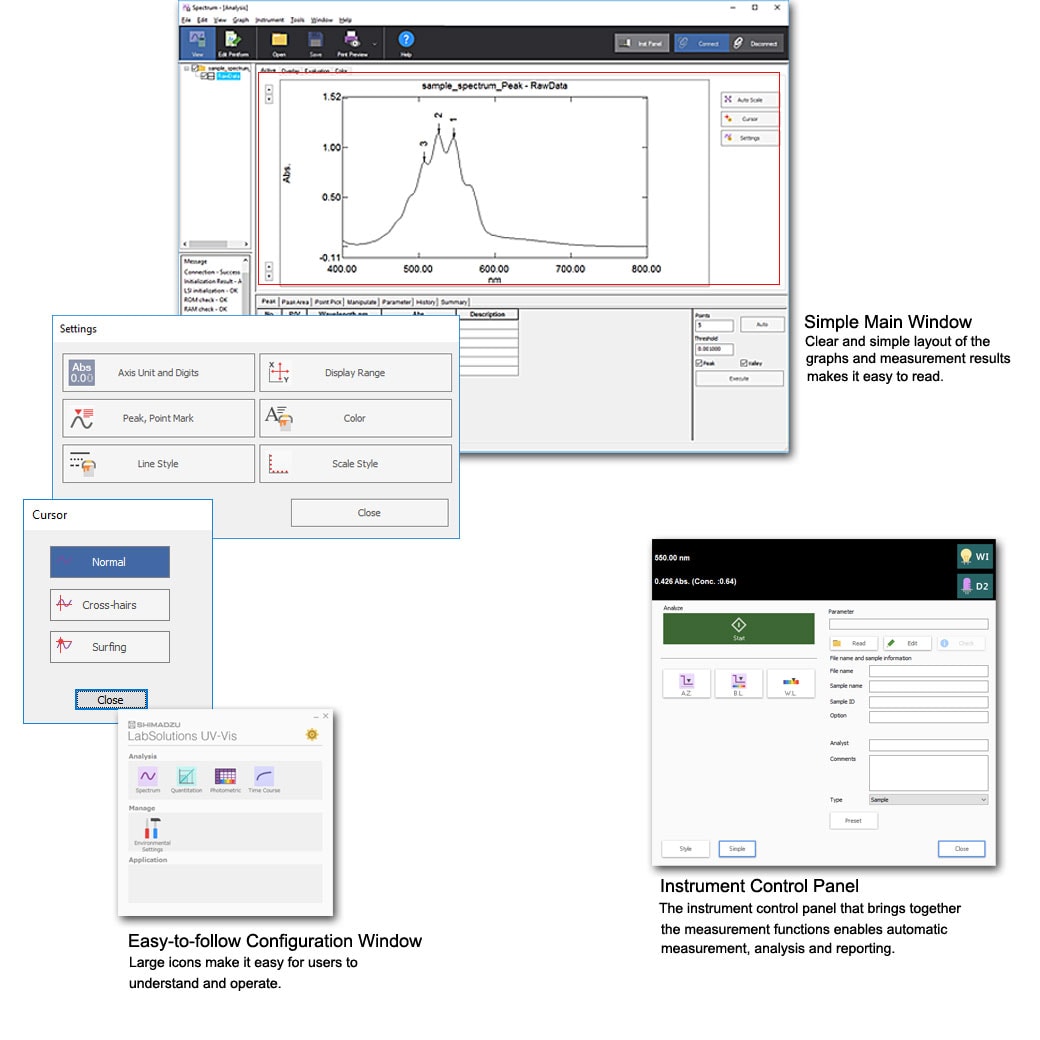
Simple Easy to use for everyone
From the start, the software’s user-friendliness allows users to perform operations with ease.
With extensive features, LabSolutions UV-Vis meets a wide range of users’ expectations.
Simple Design
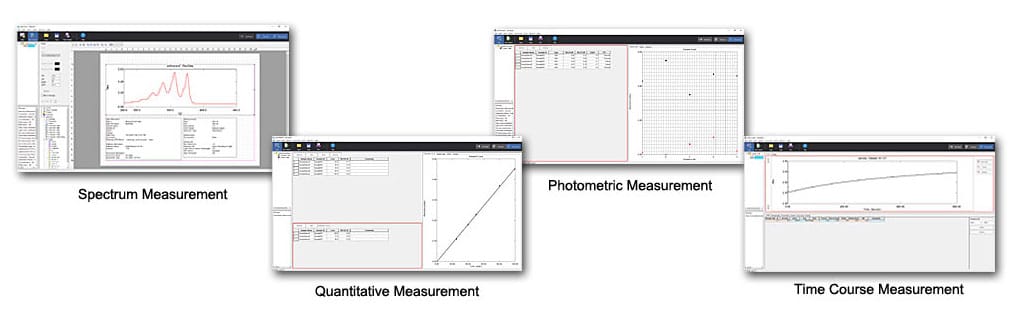
Four Measurement Modes
- It permits four measurement modes: spectrum, quantitative, photometric, and time course.
- Users can open multiple measurement modes at the same time, so that data analysis can be performed in one mode while collecting data in another mode.
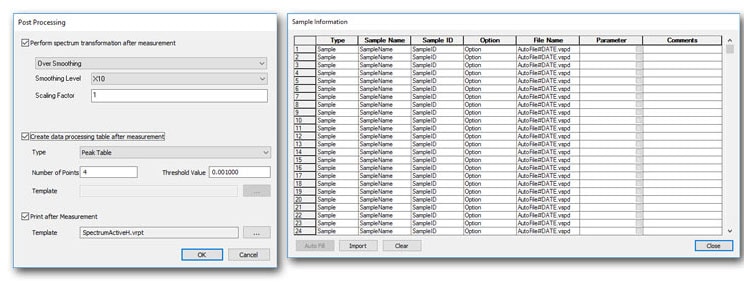
Measurement
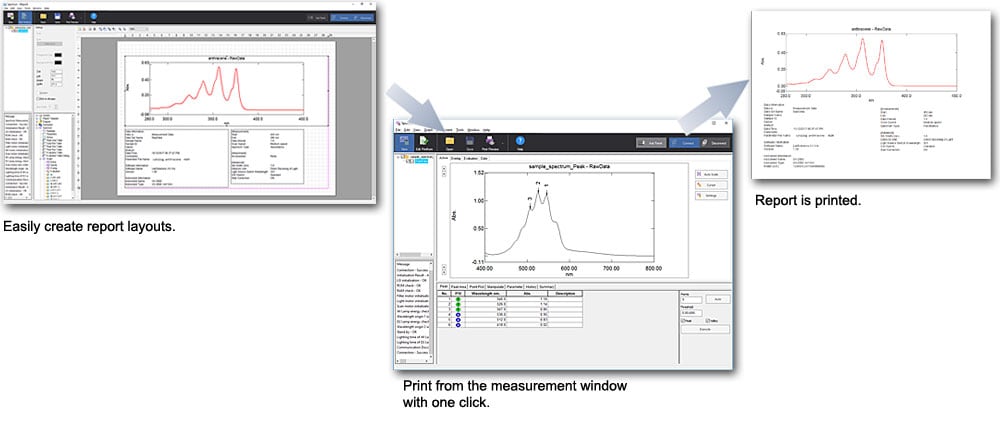
- Post-measurement correction of waveform, peak detection, and printing can be done automatically.
- Sample names to analyze are collected and read from a CSV file in advance.
- In quantitative measurement and photometric measurement, samples to be re-measured can be set up with ease.
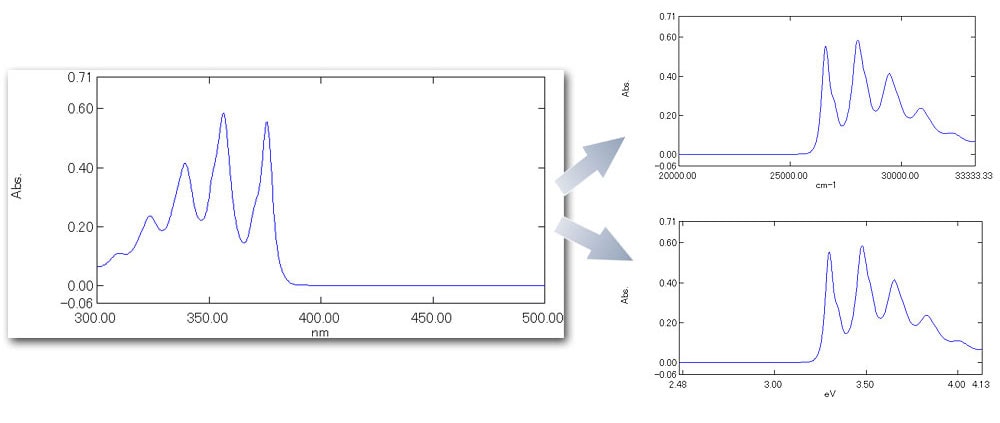
Graph
- Horizontal axis of the spectral graph can be set to wavelength, wavenumber or energy.
- Fine adjustments can be made with one click on the graph scale.
- Graphs can be easily pasted into other applications as bitmap images.
Report
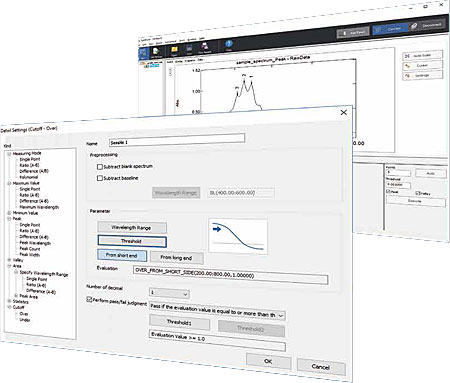
Smart Optimize quality control
In addition to providing measurement and analysis results, judgment results are also provided.
With this feature, LabSolutions UV-Vis enables users to maintain a product’s quality.
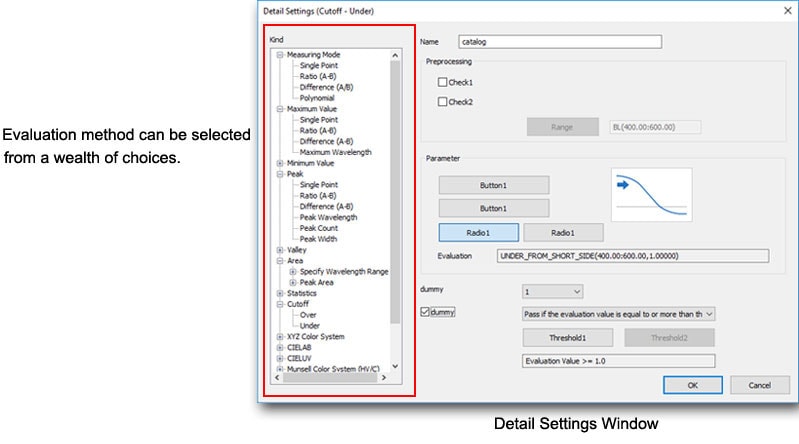
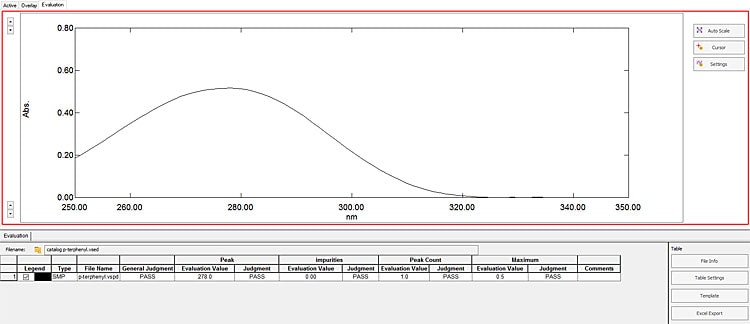
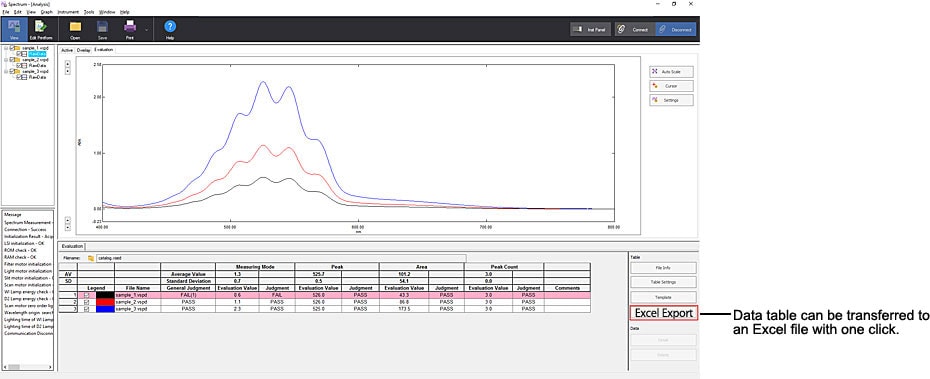
Spectra Evaluation Function
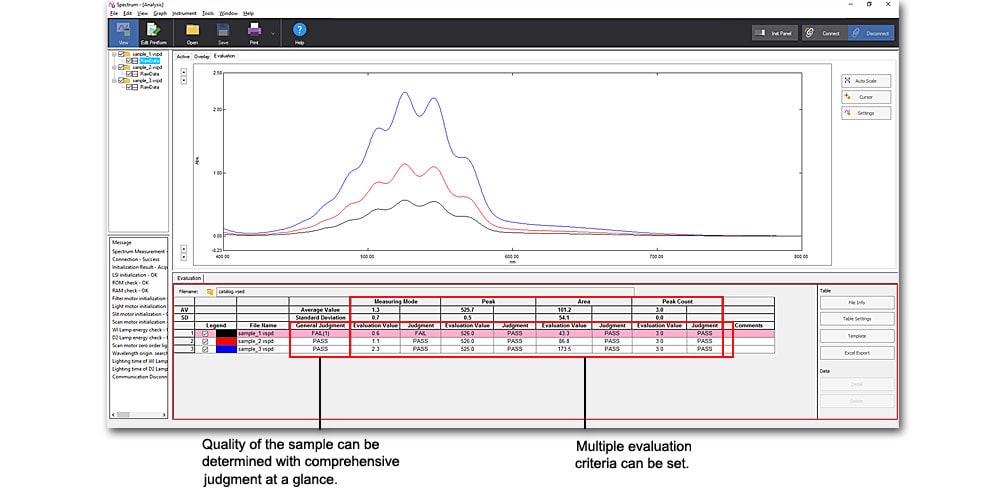
- Evaluation conditions can be saved to a file.
- Operations from measurement to judgement can be performed automatically.
- Evaluation results report can be printed with one click.
Case 1: Validation Test in Drug Development
- Peak exists in the 270 to 280 nm range.
- Peak does not exist in the range > 320 nm.
- Only one peak exists in the 260 to 300 nm range.
- The peak intensity is > 0.45 Abs.
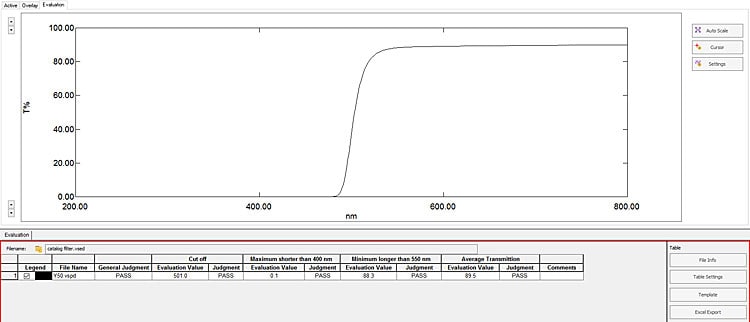
Case 2: Quality Inspection of UV Cut Filter
- The first wavelength is < 550 nm when transmittance exceeds 50%.
- Maximum transmittance below 400 nm is < 1.0 %.
- Minimum transmittance above 550 nm is > 80.0 %.
- Average transmittance above 550 nm is > 85.0 %.
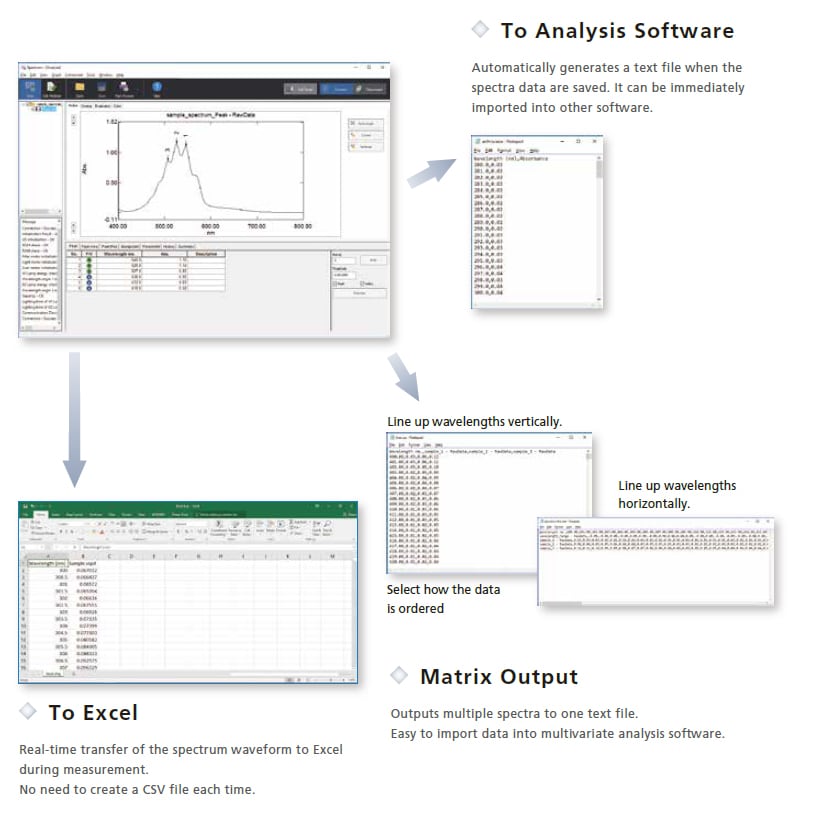
Seamless Easy transfer of measurement data
- Users want to export measurement data immediately in text format,
- and import for analysis in other software, such as Excel.
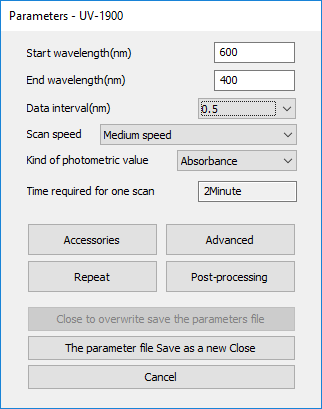
Other Convenient Functions
Predict the Time Required for Scanning
Display the Concentration Data in Real Time
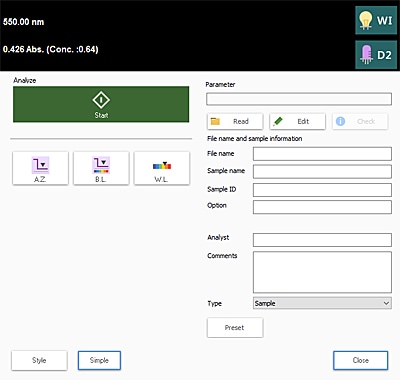
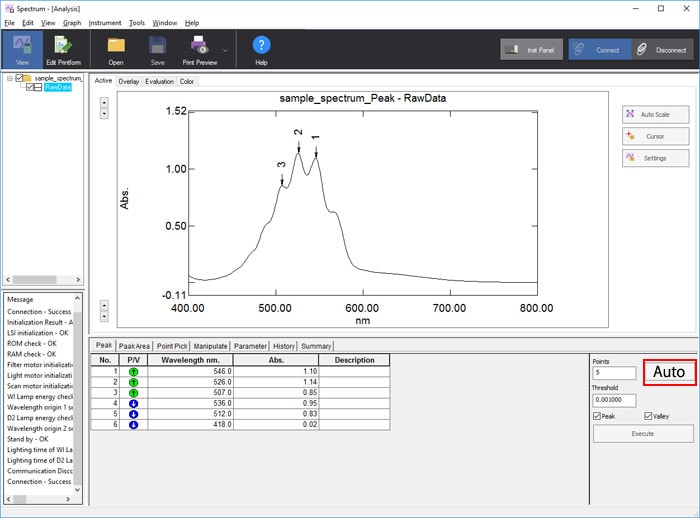
Automatically Set the Optimal Parameter for Peak Detection
Easy to Transfer Data Processing Table
LabSolutions is a trademark of Shimadzu Corporation.
Excel is either registered trademarks or trademarks of Microsoft Corp. in the United States and/or other countries.