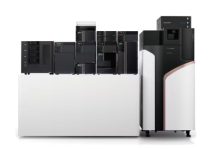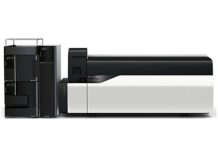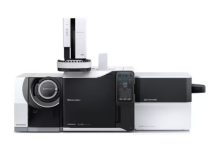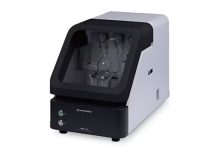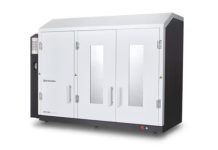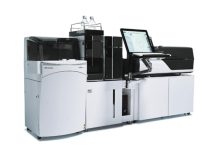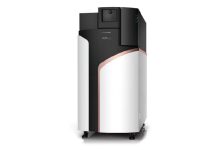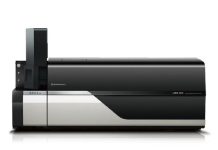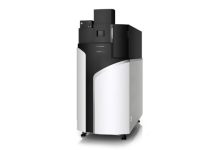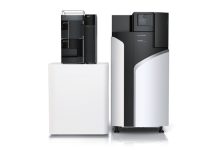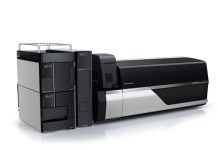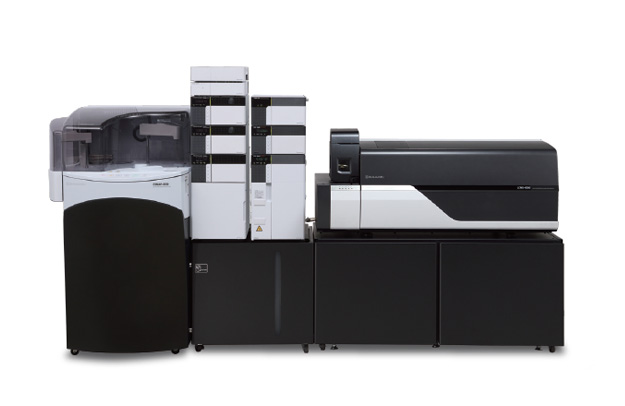
LC/MS/MS Cell Culture Media Analysis Platform Capable of Obtaining Temporal Change Profiles for Up to 95 Culture Supernatant Components
Visualization of Temporal Change for Component Variations in Culture Media
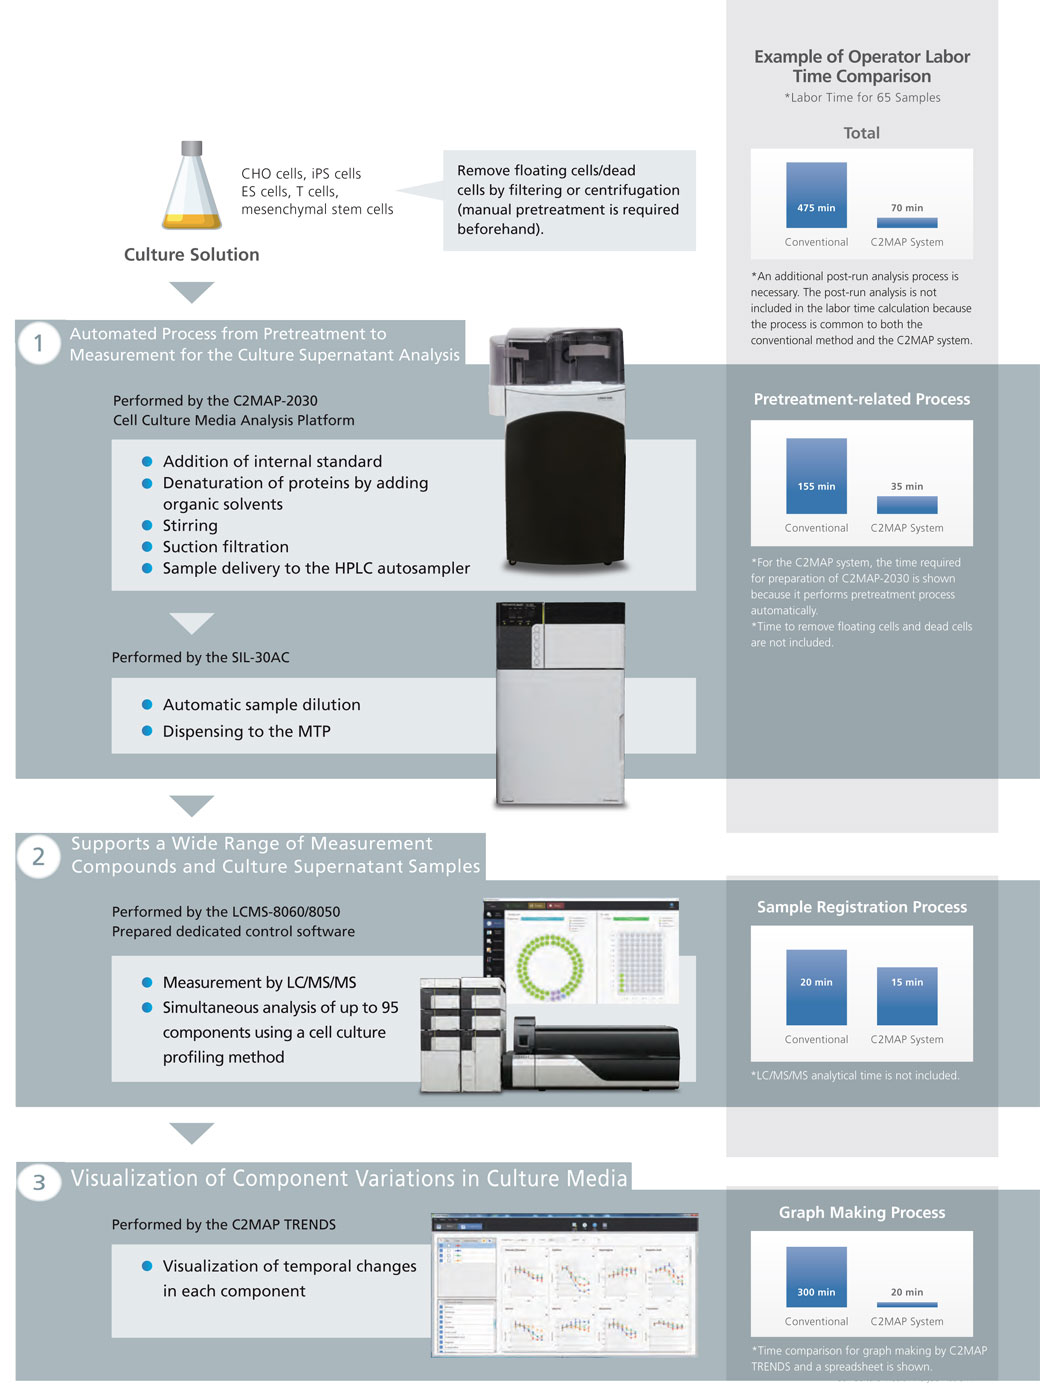
The C2MAP™ System can be automated the process from pretreatment to measurement for culture supernatant samples and display temporal changes in the components as graphs. With the optimized LC/MS/MS simultaneous analysis method, the system can be used for the optimization of culture conditions in animal cell cultures by monitoring the consumption and depletion of media components during culturing, as well as the variation in metabolites secreted from cells.

Features of the C2MAP System
1. Automated Process from Pretreatment to Measurement for the Culture Supernatant Analysis
- The automated process allows analysis to be performed at night and on non-working days.
- The measurement workflow can be selected to match the actual culture.
- Seamless analysis and management from pretreatment to LC/MS/MS measurement can be achieved.
- Pretreated samples are stocked on a microplate automatically to enable re-measurement with ease.
2. Supports a Wide Range of Measurement Compounds and Culture Supernatant Samples
- A total of 95 components, including major basal culture media components for animal cells and secreted metabolites, can be simultaneously analyzed at high speed.
- Applicable to a wide range of cell culture media
(iPS cells, ES cells, mesenchymal stem cells, T cells, and CHO cells)
3. Visualization of Component Variations in Culture Media
- Temporal changes in the components can be displayed as trend graphs.
- The results under multiple experimental conditions can be overlaid in the display, enabling comparative analysis.
Modules Required for Automated Pretreatment Can Be Operated Independently of LC/MS/MS

- The LC/MS/MS can be installed in a different room, allowing to be shared for other analyses.
- If culture samples cannot be taken out of the culture room, sample pretreatment can be performed in the culture room and measured by LC/MS/MS in another room.
- Separating the various components saves laboratory space.
C2MAP TRENDS
For results obtained via LC/MS/MS, temporal changes in each component can be graphed by the dedicated viewer software. Analysts can monitor variations in metabolites secreted from cells and culture media components during cultivation, as well as display graphs of component comparisons with samples from different culture series. As a result, the consumption and depletion of culture media components, and changes in the amounts of metabolic components secreted from cells, can be observed, thereby providing useful insights about the optimal culture conditions and assessments of cellular status.
Temporal Changes in Measured Components

Measured-component Comparisons among Different Culture Series

