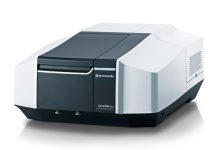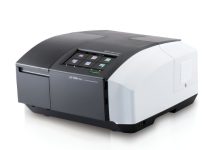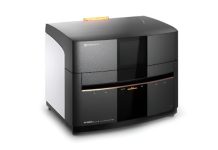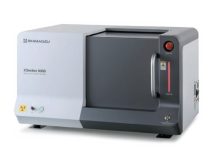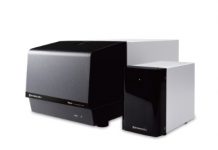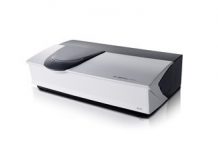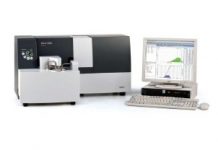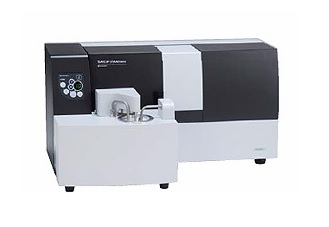
Delivering 10 times the sensitivity of previous models, this innovative analyzer is capable of continuously measuring changes in particle size and particle size distribution at one-second intervals, within a range spanning 7 nm to 800 μm. In addition, unique options that accommodate the measurement of even high-concentration samples (up to 20 wt%) and trace quantity samples (down to 15 μL) are available. Due to its leading-edge measurement capabilities, the analyzer will likely be used for many applications in new areas, including nanotechnology, the life sciences, and fine bubbles (microscopic bubbles).
Wide Measurement Range : 7 nm to 800 μm From primary particles to sub-visible particles and contaminants
- Changes in particle size across the 7 nm to 800 μm measurement range can be continuously measured using a single light source, single optical system and single measurement principle.
- Since a primary particle and an aggregate and contaminant can be measured with one system, the aggregation properties by a dispersion condition can be checked.
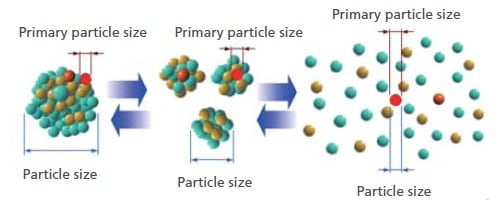
The evaluation of the dispersion and aggregation characteristics of the particles is realized with a wide measurement range and in real time.
Single detection face continuously captures forward- scattered light up to a 60° angle
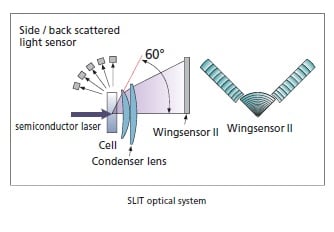
The target particle size range is seamlessly covered using a single measurement principle, single optical system, and single light source. Additionally, because the SALD-7500nano does not incorporate multiple optical systems that create discontinuities in the data, accurate particle size distribution measurements are possible across the entire measurement range using a single standard. The application of the SLIT* optical system, based on sophisticated scattered light intensity tracing technology, smashes conventional wisdom to continuously capture forward-scattered light at up to a wide 60° angle on a single detector face. This achieves high resolution in the fine particle region.
* SLIT (Scattered Light Intensity Trace)
High-Resolution / High-Sensitivity Wing Sensor ll
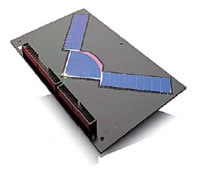
High-Resolution/High-Sensitivity Wing Sensor ll Forward diffracted/scattered light is detected by a “wing sensor ll”, a 76-element sensor developed using semiconductor manufacturing technology of the highest level. This sensor can detect greatly fluctuating small-angle forward scattering light with a high level of resolution and wide-angle scattering light of a low optical intensity with a high level of sensitivity. Also, side scattered light is detected by one sensor element and back scattered light is detected by four sensor elements. Accurately capturing light intensity distribution patterns with a total of 81 sensor elements enables the high-resolution, high-precision measurement of particle size distributions over a wide particle diameter range.
More Stable Optical System
The Omnidirectional Shock Absorption Frame (OSAF) fully isolates all elements of the optical system from shocks and vibrations. This eliminates concerns about adjusting the optical axis.
Built-in Self-Diagnostic Functions Ensure Easy Maintenance
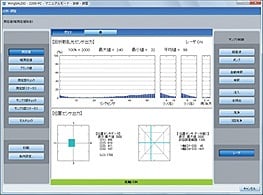
These analyzers incorporate powerful self-diagnostic functions. The output signals sent by the sensors and detecting elements and the instrument operating status can be checked, facilitating easier maintenance. Using the Operation Log function, detailed information about, for example, the instrument usage status and contamination of the cells is included with all the measurement data, making it is possible to investigate the validity of measurement data obtained in the past.
Laser diffraction method ISO 13320 and JIS Z 8825-1 compliant
Tke SALD-7500nano complies with ISO 13320 and JIS Z 8825-1 laser diffraction and scattering standards.
Validation possible with JIS standard particles
System performances can be confirmed using a MBP1-10 standard particle specified in JIS Z8900-1. These samples have a broad particle size distribution, which is specified by the JIS standard. Using these samples allows verifying that the instrument is always accurate.
Allows verifying the validity of measurement results by referencing light intensity distribution data
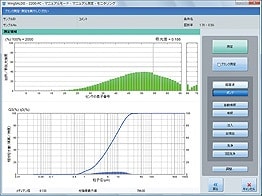
Since light intensity distribution data (raw data) and measurement results (particle size distribution data) can be displayed on the same screen, measurement results can be verified while viewing both data sets. This allows users to verify whether the detection signal level (particle concentration) is appropriate, and to confirm the validity of measurement results from multiple aspects, such as in terms of the distribution width and the presence of aggregates and contaminants.
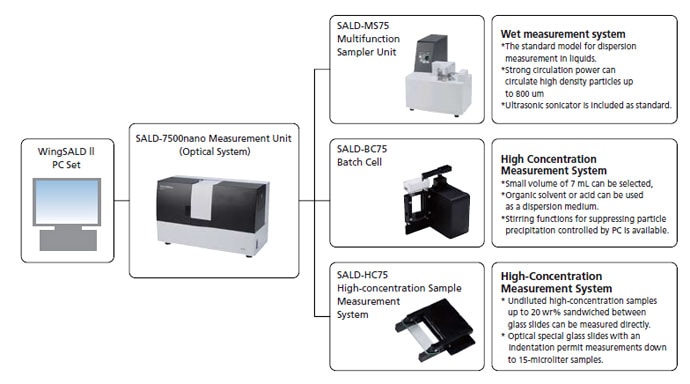
Wide application applicability
The system configuration can be optimized to address various uses, purposes, measurement objects, environments and conditions.
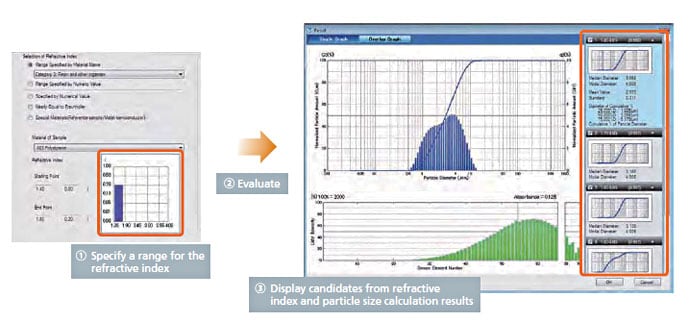
Eliminates the mistake or trouble of selecting refractive indices
Automatic Refractive Index Calculation Function
Selecting a refractive index was an unavoidable part of using the laser diffraction method, where generally a published value was entered, but such values were not necessarily appropriate, considering the effects of particle composition and shape. Therefore, tedious trial and error processes were used to select refractive indices.
WingSALD II solves such problems by being the world’s first software to include a function that automatically calculates an appropriate refractive index based on the LDR (light intensity distribution reproduction) method.
| Note: | The LDR method automatically calculates an appropriate refractive index based on consistency between the actual measured light intensity distribution and one reproduced (recalculated) from particle size distribution data. This method was developed by Shimadzu and published in two technical papers. It is sometimes called the “Kinoshita Method”, in academic communities, after the name of Shimadzu’s engineer. |
