Page 4 - LabSolutions UV-Vis
P. 4

Simple   Easy to use for everyone


            From the start, the software's user-friendliness allows users to perform operations with ease.
            With extensive features, LabSolutions UV-Vis meets a wide range of users' expectations.


                Simple Design                                                                                                             Measurement


                                                                                                                                        Post-measurement correction of waveform, peak detection, and printing can be done automatically.
                                                                                                                                        Sample names to analyze are collected and read from a CSV file in advance.
                                                                                                                                        In quantitative measurement and photometric measurement, samples to be re-measured can be set up with ease.


                                                                                                                                          Graph

                                                                                                                                        Horizontal axis of the spectral graph can be set to wavelength, wavenumber or energy.
                                                                                                                                        Fine adjustments can be made with one click on the graph scale.
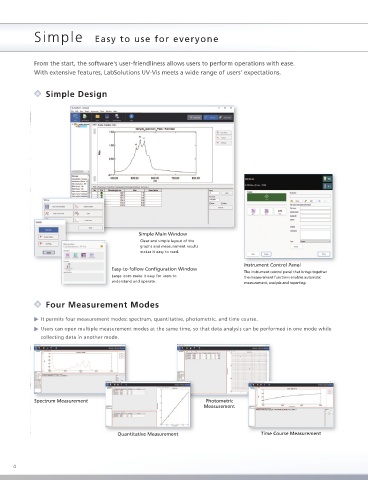
                                               Simple Main Window
                                               Simple Main Window
                                               Clear and simple layout of the                                                           Graphs can be easily pasted into other applications as bitmap images.
                                               graphs and measurement results
                                               makes it easy to read.
                                                                                  Instrument Control Panel
                                                                                  Instrument Control Panel
                                      Easy-to-follow Configuration Window
                                      Easy-to-follow Configuration Window
                                                                                  The instrument control panel that brings together
                                      Large icons make it easy for users to
                                      Large icons make it easy for users to       the measurement functions enables automatic
                                      understand and operate.
                                      understand and operate.                     measurement, analysis and reporting.
                Four Measurement Modes
               It permits four measurement modes: spectrum, quantitative, photometric, and time course.
               Users can open multiple measurement modes at the same time, so that data analysis can be performed in one mode while
               collecting data in another mode.                                                                                           Report


            Spectrum Measurement                                     Photometric                                                                                                                                   Report is printed.
            Spectrum Measurement
                                                                     Photometric
                                                                     Measurement                                                      Easily create report layouts.


                                                                                       Time Course Measurement
                                        Quantitative Measurement                       Time Course Measurement
                                        Quantitative Measurement
                                                                                                                                                                              Print from the measurement window
                                                                                                                                                                              with one click.
                                                                                                                                                                                                               LabSolutions UV-Vis
     4                                                                                                                                                                                                          Analytical Data System for UV-Vis Spectrophotometers  5
   1   2   3   4   5   6   7   8   9